A road map to a sustainable Australia: an ambitious work in progress

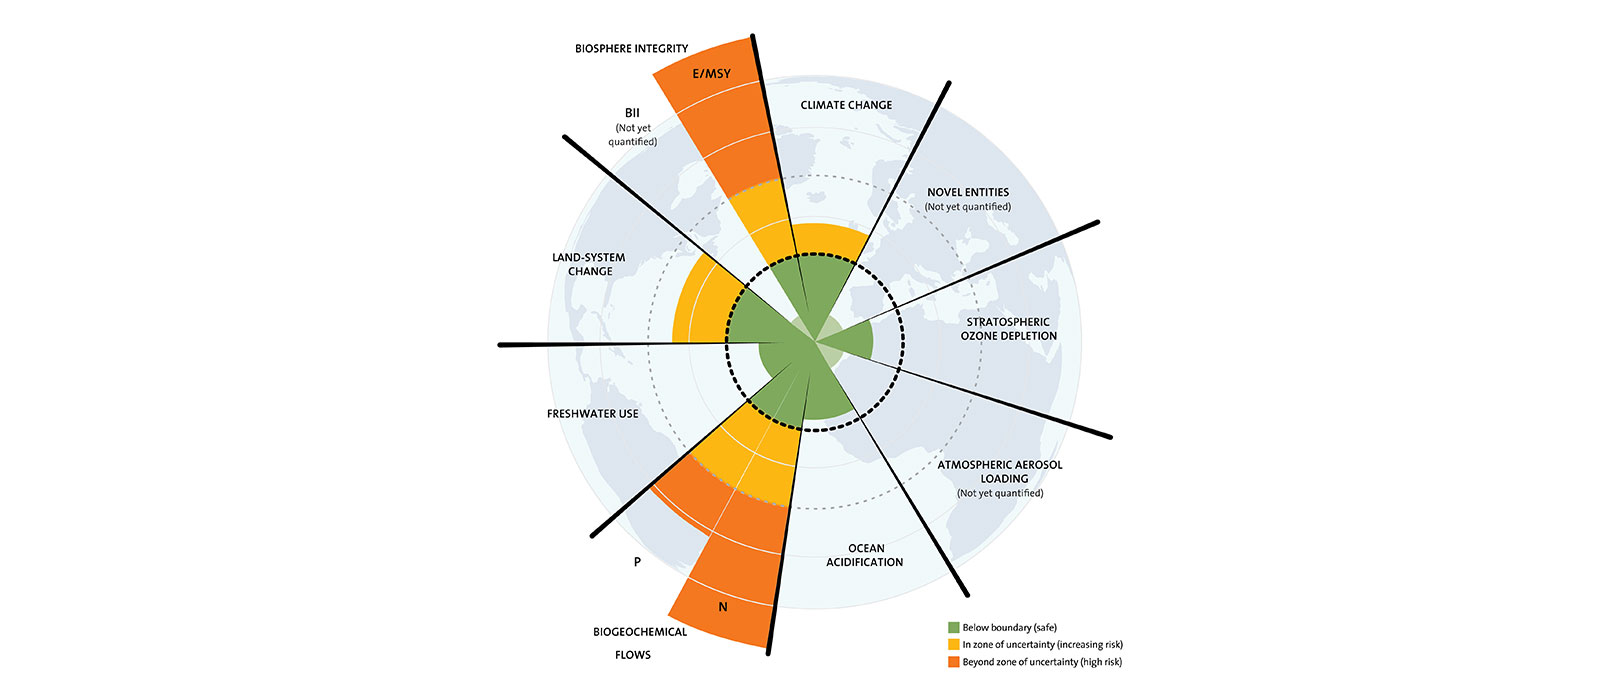
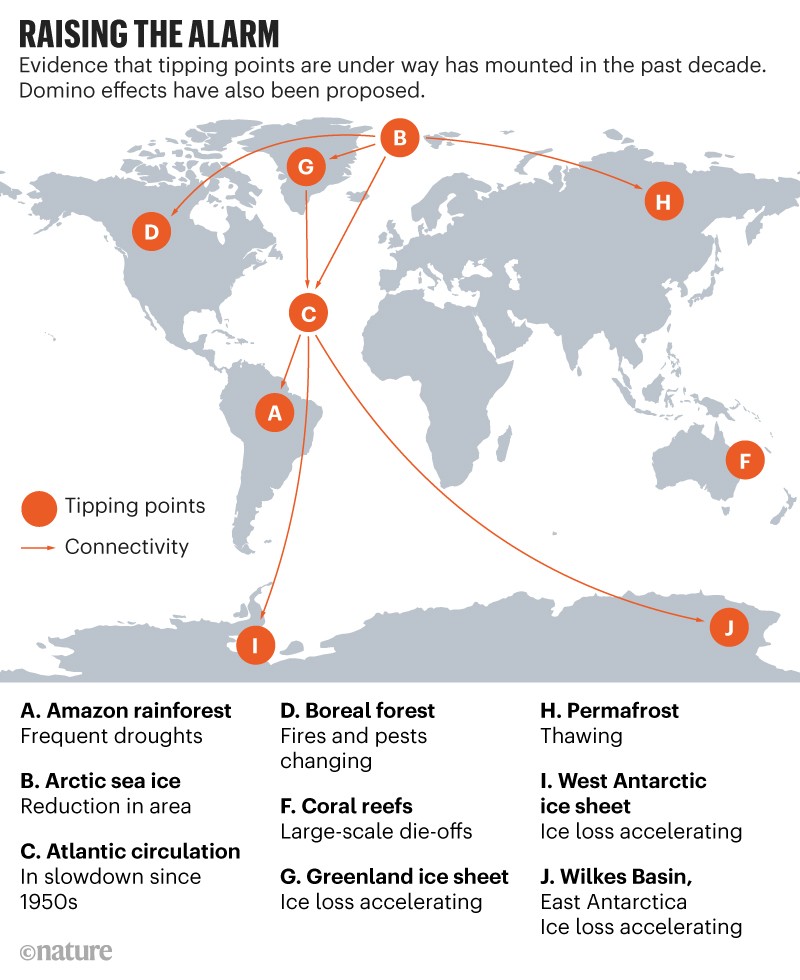
We are making changes to Earth systems biologically, radiatively, chemically – in an Earth system that is sensitive to small changes.  As global temperatures rise with emissions and land use change the risk of crossing thresholds and initiating abrupt change in Earth system increases. Tipping points are inevitable and surprises likely. They are the rationale for the 2°C target for global warming. At the same time there is a need for strong and resilient economies. 

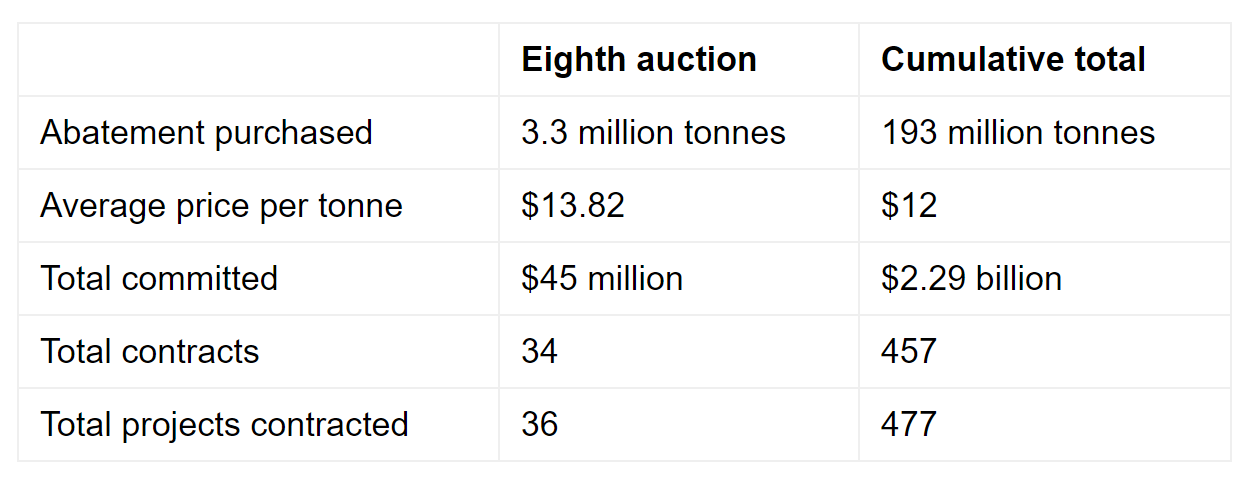
With high energy trajectories the world may limit the human population to a less than 9 billion peak in the middle of the century. High energy trajectories require nuclear energy. Factory fabricated fast neutron reactors can release all the energy a person could ever need in a Rubik’s cube sized block of conventional ‘nuclear waste’. General Atomics – 60 years in the nuclear industry – and Framatome – 40 years – are building a helium cooled 50 megawatt electric (MWe) reactor that burns undisturbed for 10 years and is then replaced with another factory unit. It will be combined with direct drive Brayton cycle turbines to produce electricity. With 21st century materials and technology they are passively safe. Lightweight, short lived fission products are removed after a burn cycle – leaving some 3% the volume of conventional waste that is radiatively safe after 500 years. The remainder is seeded with fertile material – enriched uranium, nuclear waste, depleted uranium, thorium – and recycled in another burn cycle. 50MWe generators are 1/20th size of conventional nuclear plants. Gas cooling means they don’t need a water supply. General Atomics and Framatome (Genatome?) will produce a prototype this decade for commercialisation by 2035.

Nuclear economics have been complicated by high capital costs and long lead times. Design and construction complexities cause delays. Modular design and factory fabrication of road transportable reactors simplifies production while maximising quality control and giving the economic efficiencies of mass production.

Route 1: Conscious capitalism and economically responsible government

Capitalism can generate great wealth.  Conscious capitalism aims at just and sustainable great wealth.  Conscious capitalism is big bikkies. Consumers are informed – business has to take it seriously. Government can avoid fuelling asset bubbles and add to general welfare and steady economic growth with a steady economic hand and its essential services.

Common pool resources are best sustained locally

Nobel Prize winner Elinor Ostrom’s beyond the tragedy of commons work pioneered analysis of successful cooperative management of forests, fisheries, aquifers…

Health – environmental quality – food

Everything is connected. Biodiversity is conserved – the quality and quantity of food multiplies.

Global economic development – global common pool resources – Elinor Ostrom’s polycentric management of commons – traditional or common rights.

The global economy is worth about $100 trillion a year.  To put aid and philanthropy into perspective – the total is 0.025% of the global economy.  If spent on Copenhagen Consensus smart development goals such expenditure can generate a benefit to cost ratio of more than 15 – still nowhere near the major path to universal prosperity.  Some 3.5 billion people make less than $2 a day.  Changing that can only be done by doubling and tripling global production – and doing it as quickly as possible.  Optimal economic growth is essential and that requires an understanding and implementation of explicit principles for effective economic governance of free markets.

Shared socioeconomic path 5 (SSP5) is a modern era baseline extrapolated to the end of the century. Nominally powered by fossil fuels – atmospheric carbon dioxide concentrations approach 1000 ppm by the end of the century.

https://www.sciencedirect.com/science/article/pii/S0959378016300711

SSP5Fossil-fueled Development – Taking the Highway (High challenges to mitigation, low challenges to adaptation)

This world places increasing faith in competitive markets, innovation and participatory societies to produce rapid technological progress and development of human capital as the path to sustainable development. Global markets are increasingly integrated. There are also strong investments in health, education, and institutions to enhance human and social capital. At the same time, the push for economic and social development is coupled with the exploitation of abundant fossil fuel resources and the adoption of resource and energy intensive lifestyles around the world. All these factors lead to rapid growth of the global economy, while global population peaks and declines in the 21st century. Local environmental problems like air pollution are successfully managed. There is faith in the ability to effectively manage social and ecological systems, including by geo-engineering if necessary.
https://www.sciencedirect.com/science/article/pii/S0959378016300681

Energy transition – minerals – technology

The age of steam has ended because we have run out of steam. Australia has 35 years of black coal at current production levels.

‘In 2019, the estimate of Australia’s recoverable EDR of black coal was revised upwards from 73,719 Mt to 75,428 Mt, an increase of 1,709 Mt, or 2.3 per cent, from the previous year. Large additions to EDR came from Queensland’s Bowen Basin at the Hutton Coking Coal Project (Valiant Resources), the Olive Downs Coking Coal Project (Pembroke Resources) and Hail Creek (Glencore). Wandoan (Glencore), in Queensland’s Surat Basin, also saw a large increase in EDR during 2019. In New South Wales’ Sydney Basin, Mount Pleasant (Mach Energy) and Mount Thorley (Yancoal) also reported increased EDR…

Total in situ resources (all categories) of brown coal, are estimated to be approximately 489,355 Mt, of which in situ EDR are 85,634 Mt, Subeconomic Demonstrated Resources are 279,224 Mt and Inferred Resources are 124,496 Mt. Total recoverable Identified Resources of brown coal are estimated at 433,360 Mt, of which recoverable EDR are 73,865 Mt, Subeconomic Demonstrated Resources are 255,763 Mt and Inferred Resources are 103,732 Mt. Nearly all of Australia’s recoverable brown coal EDR is in Victoria, with more than 90 per cent in the Latrobe Valley.’ Geoscience Australia – coal

‘Australia’s estimated conventional gas resources in 2019 include 74,992 PJ (66.69 Tcf) of 2P reserves, accounting for 70 per cent of Australia’s total remaining 2P gas reserves, and 121,140 PJ (107.71 Tcf) of 2C contingent resources. Aggregating Australia’s 2P reserves and 2C contingent resources provides a total of 196,133 PJ (174 Tcf) of conventional gas identified resources. About 93 per cent of identified conventional gas resources are located offshore along the North West Shelf of Australia. Based on 2019 production rates of 4,641 PJ (4.13 Tcf), Australia’s identified conventional gas resources would have a life of 42 years if all identified contingencies to development are mitigated.

Coal seam gas is expected to remain as Australia’s most important unconventional gas resource in the near term (Figure 1 and Figure 2). CSG is already a major source for domestic gas and LNG exports in eastern Australia. Almost all reported CSG reserves and contingent resources are located in Queensland; the remainder are in New South Wales. In 2019 Australia’s total 2P reserves are estimated as 31,597 PJ (29.79 Tcf), accounting for 30 per cent of the total remaining 2P gas reserves. An additional 26,652 PJ (23.70 Tcf) of 2C contingent CSG resources are estimated in 2019. Aggregating Australia’s 2P reserves and 2C contingent resources provides a total estimate of 58,248 PJ (53.49 Tcf) of CSG identified resources. Based on 2019 production rates of 1,603 PJ (1.43 Tcf), these identified CSG resources would have an estimated life of 36 years if all identified contingencies to development are mitigated.’ Geoscience Australia – gas

‘Australia has about 0.3 per cent of the world oil reserves. Most of Australia’s known remaining oil resources are condensate and liquefied petroleum gas (LPG) associated with giant offshore gas fields in the Browse, Carnarvon and Bonaparte basins. In addition oil resources are identified in the Perth, Canning, Amadeus, Cooper/Eromanga, Bowen/Surat, Otway, Bass and Gippsland basins.’ Geoscience Australia – oil

Australia imports oil and exports coal and gas.

https://www.rba.gov.au/publications/bulletin/2019/sep/the-changing-global-market-for-australian-coal.html

Australian gas: export and domestic consumption. Australian consumers are exposed to international prices. There never was cheap fracked gas.

https://www.rba.gov.au/publications/bulletin/2019/sep/the-changing-global-market-for-australian-coal.html

Globally we are all in the same steamboat. Coal, gas and oil are running low. Energy is everywhere – we can collect it with wind and solar technology. Cheap and getting cheaper. With some advanced nuclear reactors all the energy a person could need in a lifetime is in a Rubik’s cube of recycled nuclear waste. Using all the E = mc2. Reducing waste to 3% the volume as lightweight, short half-life fission products. Isotopes only found from human nuclear technology as they decay so quickly in nature.

Until yesterday I thought the the next big thing in nuclear energy generation would be factory fabricated, high temperature, fast neutron, helium gas cooled reactors with Brayton cycle direct drive turbines delivering power.

Br

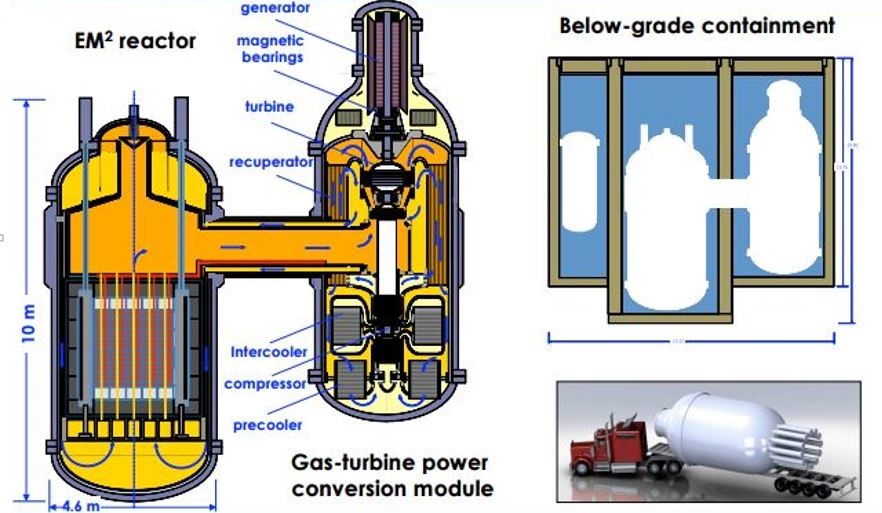
General Atomics’ 250MWe small modular fast neutron, gas-cooled reactor. The convert and burn core can run without disturbance for 30 years burning nuclear waste. Nuclear waste has 99.5% of the energy content of the original fuel and contains heavy elements that remain radioactive for 10’s of 1000’s of years. All of the energy in nuclear fuel can be used in fast neutron reactors – in the process volume is reduced to 3% of the original and consists of shorter half-life fission products that decay to background levels of ionizing radiation in 500 years. There are many times the energy content of global fossil fuel reserves in nuclear waste stockpiles. Fast neutron nuclear technology was pioneered in the 1960’s but vetoed in favor of reactors that produced waste that can be enriched to produce weapons grade material.

GA have since partnered with another giant in the nuclear industry in a 50MWe ‘plug and play version’.

SAN DIEGO, (Oct. 13, 2020) – General Atomics Electromagnetic Systems (GA-EMS) announced today that it is collaborating with Framatome Inc. to develop a new helium-cooled 50-Megawatt electric (MWe) Fast Modular Reactor (FMR) concept that will produce safe, carbon-free electricity and can be factory built and assembled on-site, which will reduce costs and enable incremental capacity additions. The GA-EMS led team will be able to demonstrate the FMR design as early as 2030 and anticipates it being ready for commercial use by the mid-2030s.

“We are extremely excited to partner with Framatome to design a safe, cost-effective, and scalable nuclear reactor,” stated Scott Forney, president of GA-EMS. “Our two companies bring together more than 100 years of combined experience in maturing advanced nuclear technologies to help secure future U.S. clean energy needs.” https://www.ga.com/general-atomics-and-framatome-collaborate-to-develop-a-fast-modular-reactor

But with the buzz on nuclear fusion at General Atomics I’m now wondering. We are in the era of hyper-technology. Anything is possible.

Magnets, motors, optics and chemical catalysts

Harvesting the promise of hyper-technology relies on mining of critical materials. ‘The rare earth metals are 15 elements in the lanthanide series of the periodic table (plus two extra ones that aren’t in the lanthanide series). They’re not, in fact, particularly rare in the Earth’s crust; according to Geosciences Australia, cerium is the 25th most abundant element in the crust. As research scientist Chris Vernon, who leads the Green Mineral Technologies initiative at CSIRO, puts it, the first rare earths on the chain, lanthanum and cerium, are “common as muck”.

The rare earths are a bit like chemical wunderkinds: they’re used for all sorts of things most of us don’t even know we need.’ https://www.ga.gov.au/data-pubs/data-and-publications-search/publications/australian-minerals-resource-assessment/rare-earths

Reserves of rare earths are growing as more are discovered. That doesn’t mean there is enough of them to waste. The secret to mining is a minimum 20 year mine life and low cost production. REO+Y2O3 – (rare earth oxide + yttrium oxide) Accessible Economic Demonstrated Resources are some 4.12 Mt oxide. Nascent production was some 0.019 Mt oxide in 2019.

Rare earths are in minable concentrations of a few percent in igneous intrusions.

Agroecology – water – soils – food sources and security.

Red meat industry carbon neutrality by 2030

https://www.mla.com.au/research-and-development/Environment-sustainability/carbon-neutral-2030-rd/cn30/

Ecological conservation and restoration – savanna, woodland, rivers, wetlands, estuaries, coasts and reefs

Land and water management – grazing – grains – mining – urban – commercial

?????

riellison@watertechbyrie.com

Posted in Uncategorized | Tagged | Leave a comment

The Chicago Boys V. Salvatore Allende, Fidel Castro and Che Guevara

I am working on a theory that the climate war is the latest manifestation of western economic conflicts between left and right.  The culture war is now fought out on blogs –- or symbolically in the streets at rallies and riots.  In politics it is a pantywaist slapfest between progressives and conservatives. On the streets it is a consilience of many colours from anarchists to ecowarriors burning cars and looting businesses. Thankfully though not so much these days as thuggery, murder and genocide.  On climate blogs it is fought in science memes.  Factoids of more or less obscure origin fired at the drooling idiot on the other side.   From extreme ends of the spectrum.   That CO2 emissions are cataclysmic to CO2 is a great boon to humanity, nature and the planet.   The 10% – split about evenly between camps – of the population who give a damn.  The rest of us want a plan that preserves economies. 

The culture war has played out historically as a clash of economic principles.  Central planning and state control V. free markets, democracy and the rule of law.  The clash of economic values continues to this day in the climate war.  The left says we can have our cake and eat it too.   I say it takes prudent economic management on principles of Austrian school of economics theory to avoid booms and busts.  Manage money supply and cash rates to limit inflation.   The left today by and large want massive spending and government control.  They are for climate change. The right want no change.  Or better yet – a return to the good ole days.  They are ag’in climate change.  The problem for the left is expense, imprudence and impracticality.  The left is inclined to state control that drifts into despotic totalitarianism.  The problem for the right is that change is the one constant.    

The economic divide stood in stark contrast in Chile in the 1970’s.  Friedrich Hayek was there working to restore democracy, the rule of law and a sustainable economic system – and is fatally tainted by association it’s claimed.  Hayek was passionately committed to individual freedom, the rule of law and democracy.  His economics were quintessentially Austrian School – his Nobel Prize contribution – money and interest rate management in the business cycle, free markets and less government planning. Government is the price of democracy. Maybe 25% of GDP if we are lucky. The free marketeers were the Chicago Boys – a Chicago University economics group – the usual suspects – with whom Hayek was associated.  They shaped up against the might of the totalitarian world.  Represented in South America by Salvatore Allende, Fidel Castro and Che Guevara. 

‘Chile had experienced high inflation and only moderate growth during the 1950s and 1960s. Development theories promoted by the United Nations Economic Commission for Latin America (ECLA), established in 1948 and based in Santiago, were quite influential in Latin America during this period. Although such theories actually have a rich previous history in economics,12 the Singer-Prebisch dependency and import substitution models provided the leading development paradigm for most countries in Latin America. The theoretical program viewed protectionism and planning as the two most important imperatives for rapid development. It was in reaction to the success of this intellectual program and its theoretical framework, plus the strong influence of Marxist ideas within certain academic circles,13 that the “Chile Project,” the cradle of the “Chicago Boys,” was begun. The project that would so greatly influence Chile’s subsequent history had its origins in Albion Patterson’s Plan Chillán in 1953.14’ Caldwell, Bruce and Montes, Leonidas (2015) Friedrich Hayek and his visits to Chile. The Review of Austrian Economics, 28 (3). pp. 261-309. ISSN 0889-3047

Chile was an economic basket case before the coup.  The coup was brutal.  But was Allende in cahoots with Castro, Mao and Stalin? Castro spent a month touring the country.  ‘In June 1973, the Chilean Supreme Court openly criticized Allende, stating that the country was facing “a crisis of the rule of law”. Op. cit.  There was a massive strike, violence and civil unrest.  As the economy spiralled down the gurgler the tensions grew with one side blaming enemies of the people and the other side blaming it quite rightly on the reckless destruction of the economy by Allende and his henchmen.

A key to stable markets – and therefore growth – is fair and transparent regulation, minimal corruption and effective democratic oversight.  Markets do best where government is large enough to be an important player and small enough not to squeeze the vitality out of capitalism.  Markets can’t exist without laws – just as civil society can’t exist without police, courts and armies. 

Responses to the climate panic are evolving around the world.  Too many on land and water topics to count.  An agricultural revolution is happening in big and small farming.  Keeping and increasing carbon in soils is the foundation for food security.  And for stewardship of the richness of the world given to us.  Global commons managed by those they most matter to – armed with science and land title.  To conserve and restore their common resources and provide for current and future needs.  On energy – it’s time to bite the nuclear bullet.  With silicon carbide fuel cladding – developed by General Atomics for the US DOE – they can’t blow up like at Chernobyl and Fukushima.  New nukes are even better.  Costs are down and getting cheaper.        

In my books – the first casualty of the climate war was science in our internet expanded public arena. In the science world – science is as imperfect and vital as ever. And then truth flew out the window. What appears more often than not is deductive reasoning with little to zilch quantitative validation – the latter only appears in scientific literature. Newton warned us about that. Not science in other words. The culture war drags on.  Informed by historic currents in the zeitgeist and powered by memes on the internet – it boils down who is in control – the State or Joe Blow everyman?  The economic culture conflict has now subsided to a melee between democratic socialists and the Chicago Boys and friends – progressives and conservatives.   Like Hayek I am neither. I believe in democracy, the rule of law and individual liberty. I have my money on business, landowners and economic freedom fighters – to solve climate change and a host of global problems this century.     

Posted in Uncategorized | Leave a comment

Tipping points in Earth’s biological and geophysical system

I fell into tipping points – pun intended.  I was rehabilitating a shallow coastal estuary – just salty enough to make a lake that smelled like rotten eggs.  The catchment is heavily urbanised and industrialised since convicts first hauled coal out of the ground.  I pulled on my waders and confidently stepped into Lake Illawarra to sink to my armpits in a morass of mud and slime.  The engineering student with me was laughing uncontrollably.  It is all parkland and water sports now.  Much as I loved my lake – I had other lakes to worry about.  All over the world shallow freshwater or brackish lakes were changing colour.  

The culprit is phosphorus.  It settles slowly with fine particles and organic detritus.  With rainfall-runoff a pulse of organic and inorganic nutrients is delivered to waterways.  In the normal course of things – oxygen penetrates lake sediments some 20 mm.  In the oxic zone – most phosphorus is oxidised and insoluble.  Some 5-15% is in reduced, soluble, bioavailable forms.  There is a little phosphene gas entering the atmosphere.  Below the oxic zone it is anoxic – organisms use crystal lattice bound oxygen leaving soluble phosphorus.  Nitrogen is also stripped of oxygen and dissipates as N2 or NOx gases.  When a pulse of nutrients arrives in a lake algae blooms.  When that dies it settles on the bottom with the likewise dead herbivores that consumed it and their faeces.  Decomposition at the bottom depletes oxygen in sediment sending accumulated and now bioavailable phosphorus into the water column.  This favours nitrogen fixers like blue-green algae.  Benthic vegetation is shaded out freeing benthic sediment.  There is a state change that is difficult to reverse.   In my lake the channel was dug out increasing tidal exchange.  That will shoal in the nature of estuarine channels.  And by running catchment drainage through sediment traps, vegetated channels and artificial wetlands.         

 A tipping point is ‘the critical point in a situation, process, or system beyond which a significant and often unstoppable effect or change takes place’. (Merriam-Webster) Earth system state space is multi-dimensional.  Not as many worlds or string theory dimensions but as fractionally dimensioned strange attractors in the state space.  When a threshold is crossed the physical system responds with positive and negative feedbacks until settling into a new climate state as the perturbation damps out.  In oceans and atmosphere hydrodynamics the rule is that big whirls have little whirls and little whirls have littler whirls and so on to viscosity.  Friction turns kinetic energy to heat.  But turbulent hydrodynamics says that the next tipping point – big or small – is not far away.  Ice, cloud, hydrology and biology respond – occasionally dramatically.  Perpetual perturbations are seen at scales of planetary waves to littler whirls.   

The biosphere is most obviously in trouble.  It needs massive efforts by billions of people to manage forests, fisheries, aquifers, rangelands and waterways.  And that takes peace, prosperity and a sense of humour.  Fauna populations are crashing globally.  The passenger pigeon’s survival strategy was sheer numbers.  As people shot them out they crossed a threshold between recruitment and mortality and crashed to extinction.  Nutrient exports from mines, farms and industrial and urban areas are land and water management fixes waiting to happen.  Land and water management is our entire future.  We have been losing carbon from agricultural soils and in traditional burning for 10,000 years.  It is time to tip the balance back by managing for positive carbon, nutrient and water budgets on 5 billion hectares of private cropping and grazing land – for more production and less inputs in everything from permaculture food forests to industrial agriculture.  To feed the world for another 10,000 years what we take from the Earth must be returned.  There is a soil carbon threshold at which land turns to desert.  Climate change means building massive factories churning out modular nuclear engines.  I want a purple one. Land and water management include holding back water in sand dams, terraces and swales, replanting, changing grazing management, encouraging perennial vegetation cover, precise applications of chemicals and nutrients, cover crops…  We need it to feed the world in the next 50 years.     

Chart, radar chart

Description automatically generated

Source:  Stockholm Resilience Centre

A 1990 geography coursework reading list included ‘Fluvial geomorphology of Australia’.  More particularly a paper by Wayne Erskine and Robin Warner on flood and drought dominated regimes (FDR and DDR) set me wondering.  Why for God’s sake are there multidecadal regimes and sudden shifts in eastern Australian rainfall?   ENSO was clearly involved – but the PDO wasn’t described for nearly another decade.      

Source:  The impacts of alternating flood- and drought-dominated regimes on channel morphology at Penrith, New South Wales, Australia

The multi-decadal rainfall-runoff variability is the result of Pacific Ocean periodicity. Positive phases of the Interdecadal Pacific Oscillation (IPO) are drought years in Australia – negative phases bring cyclones, storms and flooding rains.  And there is a flow threshold where streams change from a meandering to a braided form.  Streams slowly revert to the meandering form in IPO positive regimes.  Compare DDR and FDR with the IPO (Fig. 5) of Henley et al 2015.    Note transition years.  The pattern involves both the Pacific Decadal Oscillation (PDO) in the north – and the El Niño-Southern Oscillation (ENSO) – in the south.  Warm or cool sea surfaces persist for a while and then shift.  ENSO has a beat that shifted from 6-7 years to 2 to 5 years at the turn of the 1900’s – with more intense and frequent El Niño (Vance et 2012) – and has 20 to 30 year phases of persistent El Niño or La Niña states coherent with the PDO (e.g. Franks and Verdon 2006).   With driving winds and currents split at the equator by the Coriolis force of a spinning planet.   More flow in the Peru and California Currents shoals the thermocline and surging cold deep-water surfaces.  Trade winds intensify pushing sun warmed water against Australia and Indonesia.  More cold – and nutrient rich water surfaces in the east.  Wind and current feedbacks kick up a notch.  At some stage trade winds falter and water piled in the west surges east.  The latest Pacific Ocean climate shift in 1998/2001 is linked to increased flow in the north (Di Lorenzo et al, 2008) and the south (Roemmich et al, 2007, Qiu, Bo et al 2006) Pacific Ocean gyres. Roemmich et al (2007) suggest that mid-latitude gyres in all of the oceans are influenced by decadal variability in the Southern and Northern Annular Modes (SAM and NAM respectively) as wind driven currents in baroclinic oceans (Sverdrup, 1947). 

Is the beat of solar origin in an effect on polar vortices?  Are the 20 to 30 year Pacific state shifts an echo of the ~22 year Hale cycle?  Will cold winters return with a less active sun?  Gyre velocities are driven by the polar annular mode footprint.  In theory solar magnetism or ultraviolet may trigger shifts in hydrodynamic state space.  State space being the sum of physical states the planet can occupy within the laws of physics.  It would explain synchronous north and south Pacific flows.   There are climate limits that are found in paleo data.  States persist while small changes in the system build instabilities that at last push the system past a threshold.  That and/or a black swan event.  Perturbations in ice, cloud and biology damp out until the next tipping point.  States recur because the limits are physical – and hence the state space is ergodic.  Limits of the past 2.6 million years seem most relevant – and I take no comfort from that.                

Source:  NASA

Source: Unknown

Low level marine boundary layer stratocumulus are seen off Peru.  ‘The decks of low clouds 1000’s of km in scale reflect back to space a significant portion of the direct solar radiation and therefore dramatically increase the local albedo of areas otherwise characterized by dark oceans below.2,3 This cloud system has been shown to have two stable states: open and closed cells.’ (Koren et al 2017)  It is an example of Rayleigh – Bénard convection in which cloud cells some 20 km in diameter form in the lower troposphere.  Inside the cell water vapour condenses, droplets collide with condensation nuclei and it rains out from the centre.  Faster over warmer oceans leaving a reduced domain albedo and a positive ocean heat feedback to multidecadal – and presumably longer – eastern Pacific SST change.  Heat is gained or lost from the oceans as a subsystem shifts between warm and cool SST in the eastern Pacific.  The Pacific has been – since the early 1900’s – in a millennially warm state (Vance et al 2013) warming the planet.  

Low level cloud is some 10% in the 70% odd total planetary cloud cover – according to a New Scientist reader.   That changes dramatically in the tropical and subtropical eastern Pacific.  My favourite future tipping point is in this cloud type at levels of CO2 in the atmosphere possible by the end of the century (Schneider et al 2018).  If we burn all the fossil fuels.  The last time CO2 was at such levels there were crocodiles in the Arctic circle.   

A picture containing snow, sheep, outdoor, covered

Description automatically generated

Source: NASA Earth Observatory

‘We consider CERES TOA EEI trends for 09/2002–03/2020 and examine the underlying contributions from different atmospheric and surface variables available over that time period. Trends are determined from a least squares regression fit to deseasonalized monthly anomalies with uncertainties given as 5%–95% confidence intervals.

For this period, the observations show a trend in net downward radiation of 0.41 ± 0.22 W m−2 decade−1 that is the result of the sum of a 0.65 ± 0.17 W m−2 decade−1 trend in absorbed solar radiation (ASR) and a −0.24 ± 0.13 W m−2 decade−1 trend in downward radiation due to an increase in OLR…  Most of the ASR trend is associated with cloud and surface albedo changes (Figure 2d), which account for 62% and 27% of the ASR trend, respectively.’  (Loeb et al 2021)  

The Moy et al 2002 ENSO proxy is based on the presence of more or less red sediment in a lake core. More sedimentation is associated with higher rainfall in El Niño conditions. It has continuous high-resolution coverage over 11,500 years. It shows periods of high and low El Niña intensity alternating with a period of about 2,000 years.  There is the shift from La Niña dominance to El Niño dominance a little over 5,000 years ago that was a tipping point – and is associated with the drying of the Sahel. Note the bifurcation in the millennial band at that p0eriod.  There is a period around 3,500 years ago of high El Niño intensity associated with the demise of Minoan civilisation (Tsonis 2010).

The time “series and wavelet power spectrum documenting changes in ENSO variability during the Holocene. a, Event time series created using the event model (see Methods), illustrating the number of events in 100-yr overlapping windows. The solid line denotes the minimum number of events in a 100-yr window needed to produce ENSO and variance.  b, Most recent 11,500 yr of the time series of red colour intensity. The absolute red colour intensity and the width of the individual laminae do not correspond to the intensity of the ENSO event. c, Wavelet power spectrum calculated using the Morlet wavelet on the time series of red colour intensity (b). Variance in the wavelet power spectrum (colour scale) is plotted as a function of both time and period. Yellow and red regions indicate higher degrees of variance, and the black line surrounds regions of variance that exceed the 99.98% confidence level for a red noise process (at 4–8-yr period, the regions of significant variance are shown black rather than outlined). Variance below the dashed line has been reduced owing to the wavelet approaching the end of the finite time series. Horizontal lines indicate average timescale for the ENSO and millennial bands.”  Christopher Moy et al, 2002, Variability of El Niño/Southern Oscillation activity at millennial timescales during the Holocene epoch

Is there an equilibrium up to 20,000 years before 1993 and then a shift to a cooler state punctuated by Dansgaard–Oeschger events that get more frequent and bigger as we go back through the last glacial interlude?  It is followed by the Younger Dryas.  Not slow insolation changes that – but an ice dam bursting and freshening the Arctic.  Slow changes build to a threshold and then feedbacks in a globally coupled system pop up.  There is a pulse of solar activity somehow seemingly translating into large spikes of heat.  Sea ice breaks off from the margins and drifts south.  Thus there is high resolution data from sediment cores and a discovery of tipping points.      

Graphical user interface

Description automatically generated with low confidence

‘The temperature record from [3] and labelled D-O events 2 to 8 in blue from [4]. Low 10Be events 1 to 20 labelled in red. Note the 10Be scale is inverted. These low 10Be events would equate to an active solar magnetic field, shielding Earth from Galactic cosmic rays. It is possible that another 3 weak D-O events are present at 10Be events 7, 10 and 15.’  Source: Euan Mearns

A strong Atlantic meridional overturning circulation (AMOC) brings warm, salty water to the Arctic where it cools and sinks.  Freshening of surface water changes the threshold at which water sinks.  Less north Atlantic water is funnelled north cutting salt transport and feeding back into Arctic freshening.  At low points in Milankovitch insolation ice sheets survive summer and self-feedback into monsters.   The Arctic is about as warm and fresh as it can get.  Milankovitch insolation is at a low point.  Do the hydrodynamic math.   ‘The Atlantic Meridional Overturning Circulation (AMOC), a major ocean current system transporting warm surface waters toward the northern Atlantic, has been suggested to exhibit two distinct modes of operation. A collapse from the currently attained strong to the weak mode would have severe impacts on the global climate system and further multi-stable Earth system components.  (Caesar et al, 2021)  (If AMOC is bistable then it is multi-stable)

‘Schematic of the major warm (red to yellow) and cold (blue to purple) water pathways in the North Atlantic subpolar gyre. Acronyms not in the text: Denmark Strait (DS); Faroe Bank Channel (FBC); East and West Greenland Currents (EGC, WGC); North Atlantic Current (NAC); DSO (Denmark Straits Overflow); ISO (Iceland-Scotland Overflow). Figure courtesy of H. Furey (WHOI).

National Academies of Sciences, Engineering, and Medicine. 2013. Abrupt Impacts of Climate Change: Anticipating Surprises. Washington, DC: The National Academies Press. https://doi.org/10.17226/18373

‘As recently as the 1980s, the typical view of major climate change was one of slow shifts, paced by the changes in solar energy that accompany predictable variations in Earth’s orbit around the sun over thousands to tens of thousands of years (Hays et al., 1976). While some early studies of rates of climate change, particularly during the last glacial period and the transition from glacial to interglacial climates, found large changes in apparently short periods of time (e.g., Coope et al., 1971), most of the paleoclimate records reaching back tens of thousands of years lacked the temporal resolution to resolve yearly to decadal changes. This situation began to change in the late 1980s as scientists began to examine events such as the climate transition that occurred at the end of the Younger Dryas about 12,000 years ago (e.g., Dansgaard et al., 1989) and the large swings in climate during the glacial period that have come to be termed “Dansgaard-Oescher events” (“D-O events;” named after two of the ice core scientists who first studied these phenomena using ice cores). At first these variations seemed to many to be too large and fast to be climatic changes, and it was only after they were found in several ice cores (e.g., Anklin et al., 1993; Grootes et al., 1993),1 and in many properties (e.g., Alley et al., 1993), including greenhouse gases (e.g., Severinghaus and Brook, 1999) that they became widely accepted as real.’ Op.cit.

I don’t raise the alarm at all but there are tipping points.   Megafloods and megadroughts.  Abrupt warming or cooling of many degrees C in years or decades.  Glacials and interglacials.  Solar energy driving patterns of planetary turbulence and an ice, cloud, hydrology and biology response.   These have always been with us.  Our limited geophysical instrumental series reveal a variability that can’t be distinguished from anthropogenic warming effects (Koutsoyiannis 2020 ).   Internal Pacific Ocean variability caused some half of post 1980 warming (Kravtsov et al, 2018).   So it’s happening but perhaps not quite the end of the world yet.   

‘The growing threat of abrupt and irreversible climate changes must compel political and economic action on emissions.’ Lenton et al 2020

Source:  Lenton et al 2020 – https://www.nature.com/articles/d41586-019-03595-0

By far the best thing to do is to better manage water and land.  On 5 billion hectares of private cropping and grazing land and in global commons on which our lives depend.  I am much encouraged by progress by small, medium and industrial farmers.  To use plants to mine carbon from the sky and sock it away as organic matter in deep, rich, living soils.  It reduces input costs – increases productivity – and feels socially good.  Triple bottom line win win win – oi oi oi.  Rattan Lal – doyen of soil science and 2021 winner of the World Food Prize – says that some 500 GtC (c.f. 350 GtC of fossil fuel emissions) has been lost from agricultural soils and in traditional burning over 10,000 years – a lot in the past 200.  We should at least try to see how much can be restored this century – for biodiversity and food security.  There is no plant carbon starvation at anywhere near today’s concentration.  The great global commons are best managed by local stakeholders with global information services.  Big data can monitor most things.  It is being used to predict the behaviour of complex ecological systems – e.g. Ye et al 2014. Cooperative polycentric management of commons needs trust and transparency. Energy needs a powerful low-cost low-carbon source to meet rapid growth in demand.  Modular nuclear engines rolling off assembly lines and onto trucks – or floating out of shipyards ready to connect – to meet an energy demand growth of 350% this century – is easily the frontrunner.  There will be an energy transition – and because of course there are always creative/destructive tipping points in markets – the transition away from messy and bulky coal and gas will be rapid.  I’d guess the lifetime of coal and gas plants being built now – if in future they can still find the parts.           

Posted in Uncategorized | Leave a comment

Capability Brown’s oblique approach to climate policy

‘Remember, then, that scientific thought is the guide to action; that the truth at which it arrives is not that which we can ideally contemplate without error, but that which we can act upon without fear; and you cannot fail to see that scientific thought is not an accompaniment or condition of human progress, but human progress itself.’ William Kingdon Clifford, The Common Sense of the Exact Sciences (1885)

Damned lies and statisticians, politicians, lawyers, scientifically illiterate talking heads and philosophers. Human emitted greenhouse gases bias a chaotic system to a warmer state. There is implicit in chaos the risk of dramatic and rapid change in the Earth system – atmosphere, biosphere, cryosphere and hydrosphere. That much should be accepted as truth in line with Isaac Newton’s 4th rule of natural philosophy. There are of course those who don’t.

The range of models in the latest IPCC opportunistic ensemble is shown in blue and yellow. Above and below the mean of means. Some models are run in centres with large computing facilities. Models can be run many times with slightly different initial conditions and wildly divergent solution trajectories. Some have more modest origins.

Each of these models in the CMIP 6 opportunistic ensemble have an ‘irreducible imprecision’ or ‘evolving uncertainty’ – however one wants to put it. Below is an example of a single model run 1000’s of times. The rest is a work in progress. Yet they somehow continue to insist on the verisimilitude of models.

Source: Rowland et al 2012

Climate models have done one great thing – they introduced the world in the 1960’s to the third great idea of twentieth century physics – an idea that may still bring balance to the force.

Source: Sabine Hossenfelder & Timothy Palmer – Rethinking Superdeterminism

Climate science has been assigned a central role in a culture war that has been going on for a very long time between those who want a social and economic reset and those who instinctively resist change. Both sides feel empowered to tell themselves and others tales superficially in the dispassionate idiom of science. Both sides marshalling arguments that support the cause – certain of their moral and intellectual superiority and in arrogance, ignorance and conceit condemning the enemy in bitter animosity. It is socially corrosive and perhaps more worryingly undermines foundations of the scientific enlightenment. Moreover – the stalemate has stalled sensible progress.

‘If one seeks long-lasting impact, the best line of approach may not be head on. “Lose the object and draw nigh obliquely” is a dictum attributed to the famous eighteenth century English landscape gardener Lancelot “Capability” Brown.12 Brown’s designs framed the stately home at the entrance, but only briefly. After allowing the visitor a glimpse of his destination, the driveway would veer away to pass circuitously and delightfully through woodland vistas, through broad meadows with carefully staged aperçus of waterfalls and temples, across imposing bridges spanning dammed streams and lakes, before delivering the visitor in a relaxed and amused frame of mind, unexpectedly, right in front of the house.

That displays a subtle skill which has manifest political value: the capacity to deliver an ambitious objective harmoniously. “Capability” Brown might be a useful tutor for designers of climate policies.13 His advice would be to approach the object of emissions reduction via other goals, riding with other constituencies and gathering other benefits.’ The Hartwell Paper, 2010

‘The Paper therefore proposes that the organising principle of our effort should be the raising up of human dignity via three overarching objectives: ensuring energy access for all; ensuring that we develop in a manner that does not undermine the essential functioning of the Earth system; ensuring that our societies are adequately equipped to withstand the risks and dangers that come from all the vagaries of climate, whatever their cause may be.’  op. cit.

I’m sure it will pass. Infrastructure security is best left to technically conservative engineers. I saw a snippet of video yesterday that showed a prospective urban development disappearing under water with sea rise of 1.8m – used as justification for the great reset. It is simply not true. Infrastructure is designed for extreme conditions in which sea level rise is included. There are some things that can’t be guarded against – sea level rise isn’t one of those. One cannot protect everything – for those events there are escape routes and protection of critical emergency services planned for.

My cultural bias is freely admitted. The rule of law (property rights, government integrity, judicial effectiveness), government size (government spending, tax burden, fiscal health), regulatory efficiency (business freedom, labor freedom, monetary freedom), open markets (trade freedom, investment freedom, financial freedom). The rights bestowed on humanity by God. In concert they provide guidelines for human progress.

I have great hopes for the 21st century. What is central to renewal is an affirmation of the age old knowledge from the dawn of humanity. The collective, the tribe, the clan, the farmers cooperative is where the power for global ecological renewal is found. It is the space between governments and markets where landscapes flourish or decline. It is a profound reality that balancing the human ecology on a global scale can only be realised by working together on the ground we walk on. It succeeds with prosperous and resilient communities in vibrant landscapes. Technology we are good at. Technical innovation is the great strength of the technological monkey. It is puzzling that some seek to curtail energy technology at the level of the steam engine.

It needs only our passion for the great task of building the shining city in an Earthly garden. The blue, green, red and orange of Maree Faulkner’s Solar City signposts endless new possibilities for the human ecology. Great and shining cities rising in a song of renewal. A great, global spanning civilisation forged this century and nested in a profusion of nature. Populations replanting and replenishing in a triumph of human ecology in the Earthly garden – a sound foundation for our next steps to the stars. Great art and great music flourishing – song and poetry inspiring and amusing. Technologies proliferate and will be directed to the tasks of bringing our lives into balance with the world. The great task of renewing our world and empowering its peoples will bring a resolution that releases immense energies. What seem like dire and insoluble problems of the moment will fade like midnight forebodings in the morning light. Take heart and celebrate the advent of the shining city with laughter, songs and dance.

Posted in Uncategorized | Tagged , | 1 Comment

Thresholds and epochs in the Grand Climate System

The map – a thermally enhanced satellite photo – below shows September 2015 sea surface temperature anomalies – that is the difference from average temperatures over a period. During the most resent El Niño.  The oceans have a sun warmed surface layer overlaying the cold depths. Wind and planetary spin keep oceans and atmosphere constantly in motion. In places surface water sinks – driving deep ocean currents – and in others it upwells. Energy moves from the Sun to oceans and land from tropics to poles, to the atmosphere and out to space. It is technically a coupled, nonlinear system far from thermodynamic equilibrium.  A characteristic behavior of the Grand Climate System is relatively stable states punctuated by abrupt shifts that owe more to internal dynamics of the system as a whole than external factors such as greenhouse gases.  Traditionally called oscillations – they are more correctly in modern terms quasi standing waves in spatio-temporal chaos.   They are shifts in patterns of ocean circulation triggered by small changes in the Earth system.  Such as orbits, solar activity and greenhouse gases.

Grand climate
Source: NOAA NESDIS

‘We are living in a world driven out of equilibrium. Energy is constantly delivered from the sun to the earth. Some of the energy is converted chemically, while most of it is radiated back into space, or drives complex dissipative structures, with our weather being the best known example. We also find regular structures on much smaller scales, like the ripples in the windblown sand, the intricate structure of animal coats, the beautiful pattern of mollusks or even in the propagation of electrical signals in the heart muscle.”  Max Planck Institute

“You can see spatio-temporal chaos if you look at a fast mountain river. There will be vortexes of different sizes at different places at different times. But if you observe patiently, you will notice that there are places where there almost always are vortexes and they almost always have similar sizes – these are the quasi standing waves of the spatio-temporal chaos governing the river. If you perturb the flow, many quasi standing waves may disappear. Or very few. It depends.’  Tomas Milanivic

Polar annular modes are immense cyclones spun up over the poles by planetary rotation.  Imagine seesawing masses of frigid air spinning off high latitudes.  Where it meets warmer moist air it rains.  Coriolis force spins up wind driven currents into gyres in all the world’s oceans.  The physical mechanisms were described by great men of the Norwegian school of oceanography in the first half of the 20th century.   

This newish temperature index of Pacific Ocean states shows the warm ‘V’ and cool surrounds of a warm state.  Over the Pacific hot spot cloud is drying and dissipating adding gargantuan energies to the system.   These temperature patterns  shift between warmer and cooler irregularly.   The developers of the index call it epochs.  Based on multiple equilibrium states and sudden shifts – more likely evolving patterns in spatio-temporal chaos.  This pattern has profound effects on global weather and climate and it shifts at multidecadal to millennial scales.

Source: TPI (IPO( Tripole Index for the Interdecadal Pacific Oscillation

There are epochs triggered by changes to Earth system boundary conditions.  As far as I can tell the limits to climate change are some -10 and +12 degrees C.  In as little as a decade in some places.  Low summer Northern Hemisphere insolation and a cooler north Atlantic with glacial ice sheet growth.   Or cloud evaporating away.  The answer to this problem in fluid dynamics is literally incalculable.  

Posted in Uncategorized | Leave a comment

Using all of the heavy elements in nuclear waste to provide energy

Light water nuclear reactors use half a percent of the energy in nuclear fuel.  The rest goes to waste as heavy elements that decay to safe levels of radioactivity over hundreds  of thousands of years.  What if we could use all of the heavy elements and have a waste that contains only lightweight fission products that decay to background levels of radioactivity in 500 years?  This is an advanced reactor design that could use all the energy in nuclear fuel, remove short lived, light fission products  as waste with AIROX dry separation and recycle heavier elements in a closed nuclear fuel cycle.

This is General Atomics proposed EM2 250 MWe high temperature, helium gas cooled fast nuclear reactor.  They have built helium cooled reactors.  It is not new technology but uses 21st century methods and materials.  It will use silicon carbide fuel cladding rather than the aluminium alloy cladding used at Chernobyl and Fukushima – where the cladding melted generating hydrogen that then exploded dispersing radioactivity over large areas.  The silicon carbide cladding can’t melt down at any feasible temperature.  I note that they have recently announced a joint venture with a subsidiary of Électricité de France to develop a 50MWe version aiming for commercial deployment is 2035.  A 50MW fast modular reactor (FMR) would be ideal for plug and play use with many applications.

em2-summary

Factory built – runs for 30 years without refueling.  Return the entire unit to the factory – no need to open the fuel core on site at all.

GA em2

Recycle fuel and remove fission products.

Many times using conventional nuclear waste as a source of 100’s of years of safe reliable energy.

Creating much less waste – that has much lower activity.

Posted in energy, Uncategorized | Tagged | Leave a comment

Are we to let people starve while the powerful grow bioenergy and restore forests for their tranquility?

The bottom line here is that misguided climate policy can and has increased poverty and hunger.  There are better ways forward on liberal principles evolved since the Scottish Enlightenment – on which the US for one was founded.  The rule of law (property rights, government integrity, judicial effectiveness), government size (government spending, tax burden, fiscal health), regulatory efficiency (business freedom, labor freedom, monetary freedom), open markets (trade freedom, investment freedom, financial freedom).  In concert they provide guidelines for human progress that form the basis for progressive liberal democratic governance the world over. 

“All the models apply a uniform carbon price, with the agricultural sector included
in the carbon-pricing scheme. Except for IMAGE, all the models assume land-use competition among food, bioenergy crops and afforestation.”  Fujimori et al 2019: A multi-model assessment of food security implications of climate change mitigation

The most effective climate response does not require such an invidious compromise.  The graphic below is sourced from the Heritage Foundation – a Washington think tank.  Criteria important in social progress and economic growth are scored in countries around the world and the results rankled.  It shows a tremendous decline in poverty over the last few decades.  Something ardently to be desired.  

Source”  Heritage Foundation

‘Today, we live in the most prosperous time in human history. Poverty, sicknesses, and ignorance are receding throughout the world, due in large part to the advance of economic freedom. In 2021, the principles of economic freedom that have fueled this monumental progress are once again measured in the Index of Economic Freedom.

“To build a better world, we must have the courage to make a new start. We must clear away the obstacles with which human folly has recently encumbered our path and release the creative energy of individuals. We must create conditions favourable to progress rather than “planning progress.”… The guiding principle in any attempt to create a world of free men must be this: a policy of freedom for the individual is the only truly progressive policy.”

— Friedrich A. Hayek

The reality of the Paris climate accord is a 3 billion metric ton increase in electricity and heat greenhouse gas emissions per year by 2030.  A sector responsible for just 25% of global greenhouse gas emissions.  Energy choices for much of the world are those that provide the most productive path to development.  At this time the choice is natural gas or high efficiency low emission coal technology  The former emit some 50% and the latter some 10% less carbon dioxide than the coal plants formerly deployed – and negligible amount of sulfur, nitrous oxides, mercury or sulphur and black carbon particulates.  There are many HELE plants being built or planned across Asia and Africa. 

hele

Source: ASEAN Energy Equation

The bulk of greenhouse gas emissions come from land use changes and farming or in the form of nitrous oxides from internal combustion engines and nitrogen fertilizers and methane from many sources.  As well there is the inexplicably neglected strong warming from black carbon.  Or now unnecessary CFC use.  These are controlled with existing technology available to technologically advanced economies.  With immense health and environmental benefits.

Deserts are being reclaimed. Forests, grasslands, wetlands and coastlines conserved and restored.  The key is water.  The African NGO Excellent Development has a goal of a million sand dams for half a billion people by 2040.  A cost effective way to transform a continent.  And sequester immense amounts of carbon dioxide.  

Food security requires doubling of food production – and much more meat – by 2050.  It can only be done by building living, more fertile soils – returning lost carbon in the process.  This soil carbon store can be renewed by restoring land. Holding back water in sand dams, terraces and swales, replanting, changing grazing management, encouraging perennial vegetation cover, precise applications of chemicals and adoption of other management practices that create positive carbon and nutrient budgets and optimal soil temperature and moisture. Atmospheric carbon is transferred from the atmosphere to soil carbon stores through plant photosynthesis and subsequent formation of secondary carbonates.  It is based on sound soil science and modern farming practices.  

Carbon sequestration in soils has major benefits in addition to offsetting anthropogenic emissions from fossil fuel combustion, land use conversion, soil cultivation, continuous grazing and cement and steel manufacturing.    Restoring soil carbon stores increases agronomic productivity and enhances global food security.  Increasing the soil organic content enhances water holding capacity and creates a more drought tolerant agriculture – with less downstream flooding.  There is a critical level of soil carbon that is essential to maximising the effectiveness of water and nutrient inputs.  Global food security, especially for countries with fragile soils and harsh climate such as in sub-Saharan Africa and South Asia, cannot be achieved without improving soil quality through an increase in soil organic content.   Wildlife flourishes on restored grazing land helping to halt biodiversity loss.  Reversing soil carbon loss is a new green revolution where conventional agriculture is hitting a productivity barrier with exhausted soils and increasingly expensive inputs.

Increased agricultural productivity, increased downstream processing and access to markets build local economies and global wealth.  Economic growth provides resources for solving problems – conserving and restoring ecosystems, better sanitation and safer water, better health and education, updating the diesel fleet and other productive assets to emit less black carbon and reduce the health and environmental impacts, developing better and cheaper ways of producing electricity, replacing cooking with wood and dung with better ways of preparing food thus avoiding respiratory disease and again reducing black carbon emissions.  A global program of agricultural soils restoration is a foundation for balancing the human ecology.

Posted in Uncategorized | 1 Comment

Economics, Environment and Energy

The increase in the retail price of electricity as a result of 80% renewables penetration (in the US) by 2050 is estimated at some $30/MWh.  The current average retail price is some $13/MWh.  Such high penetration depends in large part on technologies that don’t yet exist.  The Australian Greens ‘plan’ is for 100% renewables by 2030.  What’s a more practical alternative?

Black carbon, sulfate, nitrous oxides, methane and chlorofluorocarbons are all pollutants caused by human activities – from burning fossil fuels but also from cooking fires and burning forests and grasslands.  Methane comes from mining and pipelines, sewage treatment, piggeries, cattle feedlots and landfill.  They are enormously harmful to human health and global ecosystems.  Chlorofluorocarbons are a legacy gas used as a propellant in spray cans and in refrigeration.  They destroy radiation shielding ozone in the stratosphere.  There were ready replacements and they were banned in 1996 – but still are 2% of global greenhouse gas emissions.  

Black carbon has a climate forcing of some 1.1 Watt per square meter (Bond et al 2013) – more than carbon dioxide from electricity production.  Sulfate is nominally cooling – although this is confounded with the lensing effect in mixed black carbon, sulfate and primary organic aerosols present in all anthropogenic (human origin) emissions (Gustafsson and Ramanathan 2016). This amplifies black carbon warming 2.4 times.  

“Time-course evolution of BC aerosol composition, light absorption (where EMAC-BC is the enhancement because of coatings), and associated climate effects (as DRF).”

Source:  Gustafsson and Ramanathan 2016

For the future the imperative is to invest in energy research and development – not least because without the innovation windfall future economies are at risk. I’m not adverse to even wind and solar. It adds some 10% to my bill for some 7% of electricity generation. Although for some time hugely skeptical – I would count the experiment a success. Levelized costs of wind an solar are now lower than alternative sources of electrons – and solar is now on the verge of another technology revolution. But despite the heroic modelling of the US National Renewable Energy Laboratory (NREL) we are now at physical and technology limits.

The graphics below show the energy mix and the increased cost for 80% renewables by 2050.  The current average retail price of electricity in the US is $13/MWh.


Source: NREL Renewable Energy Futures Study

At this right price – the principle of economic substitution kicks in.  With the right technology – and there are dozens in development – Schumpeter’s principle of creative destruction of capitalism will revolutionize energy systems.  

Emissions of black carbon, sulfate and nitrous oxides are neither necessary or desirable from power plants or transport.  Modern power plants emit virtually no (0.01%) pollutants – and reduce greenhouse gas emissions by 10%.  They are very much at the forefront of current ASEAN development and energy planning.  All consistent the Paris emissions accord.  Greenhouse gas emissions from power plants are some 25% of total greenhouse gas emission, transport 14%.

Source: ASEAN’s Energy Equation

Technology for reducing black carbon emission is very advanced in modern vehicles.

Source:  Bond et al 2013

Some nitrous oxides come from vehicles – and about half of volatile organic compounds. These complex in sunlight to form damaging photochemical smog. They are amended in modern vehicles with catalytic converters and complex engine management systems that burn air and fuel at a near perfect stoichiometric ratio.  Most anthropogenic nitrous oxides come from applications of nitrogen fertiliser.  Precision agriculture overcomes by applying nitrogen where, when and and in the quantity needed.  It lowers cost, increases productivity and safeguards downstream environments.  Nitrous oxides are about 8% of greenhouse gas emissions.

Methane is not damaging in itself – unless it blows up. Methane is derived from anoxic digestion of organic material. Fugitive emissions from mines and pipelines is an economic cost. Other sources include sewage treatment, landfill, piggeries and cattle feedlots. Anoxic digestion of organic matter creates creates methane and soluble and mobile forms of nitrogen. When accumulated in groundwater used in baby formula nitrates inhibit oxygen assimilation. In streams and oceans they result in eutrophication. Methane from responsible waste management provides cost competitive energy sources. Methane is about 14% of total emissions.

Progress has been made – as you can see in the regional pattern of black carbon emissions.  Wealthy countries are doing better than less developed.

Source:  Bond et al 2013

Further progress can be made with continuing economic growth. Including on emissions from farming and forestry – some 24% of the total. This can be radically turned around with existing technology and management systems to double food production by 2050, enhance flood and drought resilience and to stop soil washing away losing fertility in farmland and degrading downstream environments.

Source:  Heritage Foundation 2019 Index of Economic Freedom

Increased agricultural productivity, increased downstream processing and access to markets build local economies and global wealth.  Economic growth provides resources for solving problems – conserving and restoring ecosystems, better sanitation and safer water, better health and education, updating the diesel fleet and other productive assets to emit less black carbon and reduce the health and environmental impacts, developing better and cheaper ways of producing electricity, replacing cooking with wood and dung with better ways of preparing food thus avoiding respiratory disease and again reducing black carbon emissions.

Posted in Uncategorized | Leave a comment

100% renewables by 2030 and no Adani mine – let’s save the world from climate activists

Australia committed in Paris in 2015 to a 26% reduction on 2005 in CO2 equivalent emissions by 2030.  On a per capita basis that is a 60% reduction.  The Australian Liberal Party has a holistic policy including a safeguard mechanism as plan B.  The Labor Party seems to have only a very costly plan B.  In the order of a $12B slug to Australia’s biggest businesses – probably not terminal.  But whoever wins 100% renewables by 2030 is not on the agenda.  Politicians in general are not all that bright.  We get the ones we deserve.  But the Labor Party, greens and striking school girls are plumbing new depths of idiocy.  Only the girls have an excuse.

EmissionsReduction01

There is $4.55B committed to the emissions reduction fund – the green bits in the graphic.  Reductions of 193 million tonnes have been contracted with funds committed for another 100 million tonnes by 2030.  We have as well 130 million tonnes of greenhouse gas in the back pocket from overachieving on the Kyoto commitment – quite within the rules but somehow off limits apparently.

“In 2014 the Government allocated $2.55 billion to provide for purchasing in the Emissions Reduction Fund. Activities supported through the Emissions Reduction Fund provide important environmental, economic, social and cultural benefits for farmers, businesses, landholders, Indigenous Australians and others.

On 25 February 2019 the Australian Government announced the Climate Solutions Fund, providing an additional $2 billion to continue the momentum towards reaching Australia’s 2030 emissions reduction target. This will bring the total investment in the Emissions Reduction Fund to $4.55 billion and deliver around another 100 million tonnes of emissions reductions by 2030.”  https://www.environment.gov.au/climate-change/government/emissions-reduction-fund/about

There have been 8 abatement auctions for 193 million tonnes reduction at a cost of $12/tonne.  This is a very low cost with economic, farming and environmental benefits.

The graphic below shows that we are well on the way to a 26% reduction from 2005 levels – even with both a growing economy and population.  We are halfway there – and still with a handy little reserve from being a lot better than everyone else.  It is quarterly emissions so multiply by 4 to get annual emissions.  I include it because it shows how dumb the 100% renewables idea is.  Even if all emissions from electricity generation were eliminated – an impossible fantasy – it is less that one third of total emissions.

emissions by sector

Per capita abatement and efficiency improvement is even more impressive.

per caita emission change

Internationally our commitment is comparable.   You may note that China – along with other developing economies – commit to increasing emissions.

2030

Globally – most growth in emissions is coming from developing nations.  Something that is fundamental to economic and social development and environmental conservation.

Most of that will come from high efficiency low emission coal fired plants.  Australia should build 1 or 2 more.

Including in India – the market for coal from the Adani mine.  India – and other nations in the region – have the right under their Paris commitments – and the absolute moral imperative – to develop whatever resources are needed to pull billions out of abject need.

The sight of affluent Australians attempting to subvert international rules is morally repugnant.  The Labor Party and greens are both dumb and immoral.

Posted in Uncategorized | Leave a comment

Small modular nuclear reactor promise? SMR prospects are good!

Factory made, dropped into a bunker or a mine, run uninterrupted for 20 or 30 years using leftover ‘nuclear waste’ – of which there is enough for hundreds of years of energy supply.   And then recycle the fuel core to burn more of the energy in fissionable material.  Producing far more power from the same ore with with far less waste and far shorter lived – 300 as opposed to 30,000 years – fission products.  Replacing aluminium fuel cladding with silicon-carbide.  Melting aluminium in superheated steam produces hydrogen which then explodes.  In the history of bad ideas – this one gave us Chernobyl and Fukushima.  General Atomics is supplying silicon-carbide coated fuel piles in different control rod shapes.  21st century materials and fuel pile design are critical to small modular reactors – quite literally.  These can’t melt down and explode whatever happens.  The nuclear pile can not get hot enough – physics says – to melt silicon-carbide fuel cladding.

The are dozens of versions of small modular reactors starting to come online around the world.  The General Atomics version is the Energy Multiplier Module – EM2.   Helium cooling instead of water means the module can be placed nearly anywhere Powering powering society for 100’s of years converting 1000’s of tonnes of existing nuclear waste into energy. 

The fuel pile can burn undisturbed for 20 or 30 years – and then be taken away and recycled – adding additional fertile material –  and removing a few percent of light fission product in an AIROX process.

EM2 fuel cycle

The left bar is the creation of an intractable problem with long lived radioactive isotopes – and a huge waste of a resource.  What remains with EM2 are fission products – the rest of the mass is converted to energy – E-MC2 – that decay and lose heat in 100’s of years rather than 10’s of 1000’s.

em2-waste-reduction

The fourth objective – after safety, waste and proliferation is cost.  If it doesn’t work commercially it doesn’t work period.  Below is estimated costs of 8 advanced reactors in the US.  On average a sizable cost reduction for these simpler, smaller, safer products.

Click to access Advanced-Nuclear-Reactors-Cost-Study.pdf

General Atomics isn’t one of the 8 – but give their break even point with natural gas as $6-7/MMBtu.  The US natural gas price is $2.95/MMBtu – with a domestic glut and export control.  Australia has an expensive regional gas price – it is tied to the price of our gas in Japan.  That’s a greenie over supply problem.  We could be frakking the hell out of things.  So for most of the world – these are looking cost competitive.  And more so as energy demand multiplies in the next few decades and supply tightens.

These SMR’s have the reverse problem of wind and solar – wind and solar don’t have enough power most of the time.  SMR have too much power most of the time as demand rises and falls.  SMR provide opportunities for other uses of heat and power.  Catalyzing production of hydrogen and oxygen from superheated steam.  Making liquid fuels from hydrogen and CO2.  CO2 from air, electricity plants or cement and steel makers? Fossil fuels do have an innate supply and demand constraint.  Fossil fuel prices get higher over time as demand increases and finite stocks are utilized.  If there is something else far safer and easier at lower cost?  There is no question.

Posted in Uncategorized | Leave a comment