
There is – according to Graham Lloyd at The Australian newspaper just today – a new study in Nature confirming a ‘slow down’ in global warming. But apparently they don’t have a clue as to why. The reason is in fact obvious in retrospect – since at least early in the 1960’s. Climate is an ergodic, complex, dynamical system. Ergodic means that it operates within limits over a very long time. Complex means that there are many interacting parts. Dynamical means that the parts change and interact continuously. Dynamical complexity is the third great idea of 20th century physics – along with relativity and quantum mechanics. But that’s enough theory.
I thought I’d start with some data – over the Quaternary – over the Holocene – and drilling down to monthly records. All in pictures. The Quaternary is the last 2.58 million years. The shoaling of the Isthmus of Panama – between North and South America – way back when changed currents in both the Pacific and Atlantic Oceans. In the Pacific the El Niño-Southern Oscillation pattern was strengthened. In the Atlantic the change in Gulf Stream flows is implicated in repeated roughly 100,000 year cycles of glacials and interglacials that is the defining characteristic of the Quaternary.
This graph below shows reconstructed polar temperatures and ice volume over the last 450,000 years. In warm periods such as the present – freshwater inflow to high northern latitudes reduces the rate of water sinking to the depths of the ocean. Sinking water draws warmer water northward in the Gulf Stream. The warm water keeps northern climes relatively benign. When the Gulf Stream slows the planet cools.

Source: Johnathon Tomkin
Glacials happen when the 100,000 year Milankovitch orbital cycle is such that summer irradiance in high northern latitudes is at its lowest point – allowing the persistence of ice fields. They are triggered by freshwater inflow to the Arctic Ocean. Large snow packs from increased evaporation in warm conditions melt in the summer. Fresh inflows reduces bottom water formation in the north Atlantic. Reduced flow in the Gulf Stream cools high latitudes and ice sheets grow. The ice itself reflects heat from the Sun back into space and the north cools further. The process is self reinforcing and runaway ice growth ultimately covers much of the north in kilometres deep ice fields.
These are abrupt changes in a complex, dynamical system. Some relatively small change in the system – long orbital cycles and fresh water runoff in the Artic – trigger a shift in planetary climate. Internal components of the climate system – ice, cloud, atmospheric moisture, vegetation, etc. – change under its own dynamic and with it climate.
“The global climate system is composed of a number of subsystems — atmosphere, biosphere, cryosphere, hydrosphere and lithosphere — each of which has distinct characteristic times, from days and weeks to centuries and millennia. Each subsystem, moreover, has its own internal variability, all other things being constant, over a fairly broad range of time scales. These ranges overlap between one subsystem and another. The interactions between the subsystems thus give rise to climate variability on all time scales.” Michael Ghil

Source: Arizona University
Changes in internal components cause rapid and extreme changes in atmospheric temperature. As much as 16 degrees centigrade locally in as little as a decade. Such rapid change – much faster and larger than slow changes in orbit or solar intensity – is the marker for internal variability. Internal changes in the deep past are indeterminate – there is simply no data on the state of the climate components. Future changes are unpredictable – far too complex. Temperature varied rapidly in the climb out of the last glacial period – as a result of ice fields changes – and peaked around 6,000 years ago.
The Holocene is the last ten or twelve thousand years. At this scale the El Niño-Southern Oscillation (ENSO) has a major influence on climate. Both on global rainfall and drought and atmospheric temperature.
 Source: Climate change and the demise of Minoan civilization
This graph shows the record of sedimentation in a South American lake. It is based on the presence of greater and less red sediment in a lake core. More red sedimentation is associated with El Niño. It has continuous high resolution coverage over 12,000 years. It shows periods of high and low ENSO activity alternating with a period of about 2,000 years. There was a shift from La Niña dominance to El Niño dominance that was identified by Tsonis 2009 as a chaotic bifurcation – and is associated with the drying of the Sahel. There is a period around 3,500 years ago of high ENSO activity associated with the demise of the Minoan civilisation. For comparison – red intensity was frequently over 200 at the time of the Minoan decline – it was 99 in the 97/98 El Niño. It shows ENSO variability considerably in excess of that seen in the modern period.
Here is particularly nice animation of ENSO processes. Note in particular the northern and southern Pacific gyres at the start of the video.
The image below shows the Pacific Ocean in the cool phase of the Pacific Decadal Oscillation (PDO) and the cool phase (La Niña) of the ENSO. Together they create a pattern of multidecadal Pacific variability. The cool oceans cool the planetary atmosphere. Conversely – the atmosphere warms during a positive PDO and El Niño.
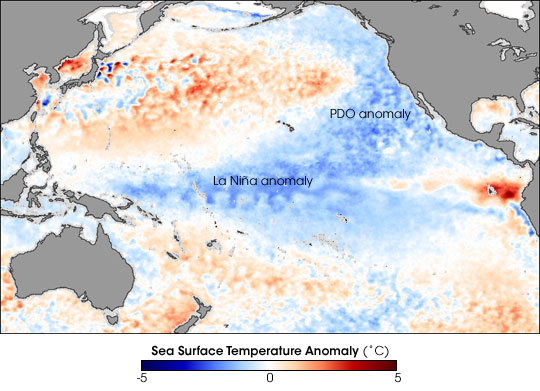
Source: NASA Earth Observatory
The Pacific gyres bring more or less cold from sub-polar regions to upwelling regions on the coast – warm surface water is displaced allowing cold water upwelling from the deep oceans to initiate. Upwelling is the other side of the coin of sinking cold and saline water in the north which drive the great ocean currents.
The strength of the gyres is dependent on differences in sea surface pressure between polar and sub-polar regions. This in turn is modulated by solar radiant heat and ultraviolet changes. Ultraviolet radiation heats ozone in the atmosphere – causing changes in atmospheric density and regional se level pressure. Changes in the gyre strength bias the Pacific system to one state or another. More or less cold and nutrient rich upwelling water driving changing global climate and ecologies.
Changes in solar activity mirror changes in the Pacific state and changes in global temperature over the past millennium. Although there is no uniform global trend – the pattern is for cooler temperatures from the 14th to the 20th centuries.

Source: Pages 2K
It coincides with a Medieval peak in solar activity and low activity through to the 20th century – as measured by isotopes of carbon. Sunlight creates isotopes in the atmosphere – higher solar activity creates more isotopes. Changes in solar activity are generally considered to be too small to affect surface temperatures much.

Tessa Vance and colleagues measured salt content in an ice core at the Law Dome in Antarctica. The graph shows dry periods (El Niñ0) in Australia. Higher salt content is La Niña. It shows La Niña dominant over much of the past 1000 years. The warming in the 20th century coincides with a 1000 year peak in El Niño frequency and intensity.
Source: Vance et al
It is suggestive of a solar control variable initiating changes in the ENSO system over 1000 years which then proceed at a rate determined by internal dynamics. It suggests that ENSO amplifies the solar signal through the climate system. The data for the past century provide a more detailed picture.
“Our interest is to understand – first the natural variability of climate – and then take it from there. So we were very excited when we realized a lot of changes in the past century from warmer to cooler and then back to warmer were all natural,’ Anstasios Tsonis.
Four multi-decadal climate shifts were identified in the last century coinciding with changes in the surface temperature trajectory. Warming from 1909 to the mid 1940’s, cooling to the late 1970’s, warming to 1998 and declining since. Although it is a global system – it is most clearly seen in the Pacific Ocean. Shifts in ocean surface temperature mirror the changes in temperature trajectory precisely. Ocean states shift abruptly at these times and are punctuated by extreme El Niño Southern Oscillation events. Fluctuations between La Niña and El Niño peak at these times and climate then settles into a damped oscillation in a new state. Until the next critical climate threshold – due perhaps in a decade or two if the recent past is any indication.
The PDO is a 20 to 30 year pattern of warmer or cooler surface water in the north-east Pacific. Cold bottom water upwells on the eastern margin. Predominantly cool (blue) to 1976, warm (red) to 1998 – blue again since.
Source: ENR
The equatorial Pacific alternates between warm and cool surface temperatures as El Niño or La Niña.

Source: Columbia University
The alternation can be seen in the multivariate El Niño-Southern Oscillation (ENSO) Index of Claus Wolter. This uses data on wind, cloud, currents and surface temperature to measure ENSO. You can eyeball the relative frequency and intensity of El Niño (red) events over the past several decades. On top of the oscillation is a tendency for changing frequency and intensity of ENSO events over the same 20 to 30 year period as the Pacific Decadal Oscillation. Blue dominant to 1976 – red to 1998 – and blue again (marginally) since.

Source: NOAA
ENSO begins with cold and nutrient rich upwelling as a La Niña starts. The cold water sets up wind and current feedbacks that piles warm surface water up against Australia and Indonesia. Cold water covers the central Pacific – cooling the planet. The winds falter at some stage – and warm water piled up in the western Pacific flows eastward resulting in warm water covers the surface – warming the planet. The warm water mixes and cools at the eastern margin and upwelling commences starting the cycle over.
We are currently at the stage of warm water dissipating leading to the inevitable emergence of a – predictably large – La Niña later this year. The north-east Pacific is currently warm as well. That too will pass. We are in a cool phase of the Pacific multidecadal variation – and the north-east Pacific is cooling.

Source: NOAA
There is natural warming and cooling over decades. An increase in the early part of the century – cooler to 1976 and warmer again since – and there’s that 2015 high temperature.

Source: GISS
The monthly temperature data below tells a couple of stories. First we see the difference between the surface land temperatures from thermometers and the land and surface ocean temperature. So why the difference? Heat has two forms – latent and sensible. It is both emitted in the infrared – measured by thermometers – and carried by evaporation and convection to higher altitudes. This latter is not measured by thermometers. Over land evaporation is limited by water availability – and so the balance of latent and sensible heat changes with rain and drought. The spike in land temperature is a result of widespread El Niño influenced drought in 2015.
Nonetheless – monthly data shows no significant increase in temperature in 2015. The difference between the monthly data and the annual mean depends to a large extent on the persistence of ENSO events during the year. The high annual mean in 2015 was because of the early onset of warm Pacific sea surface temperatures persisting through the year. Not because temperatures were radically higher at any time during the year.
Source: GISS
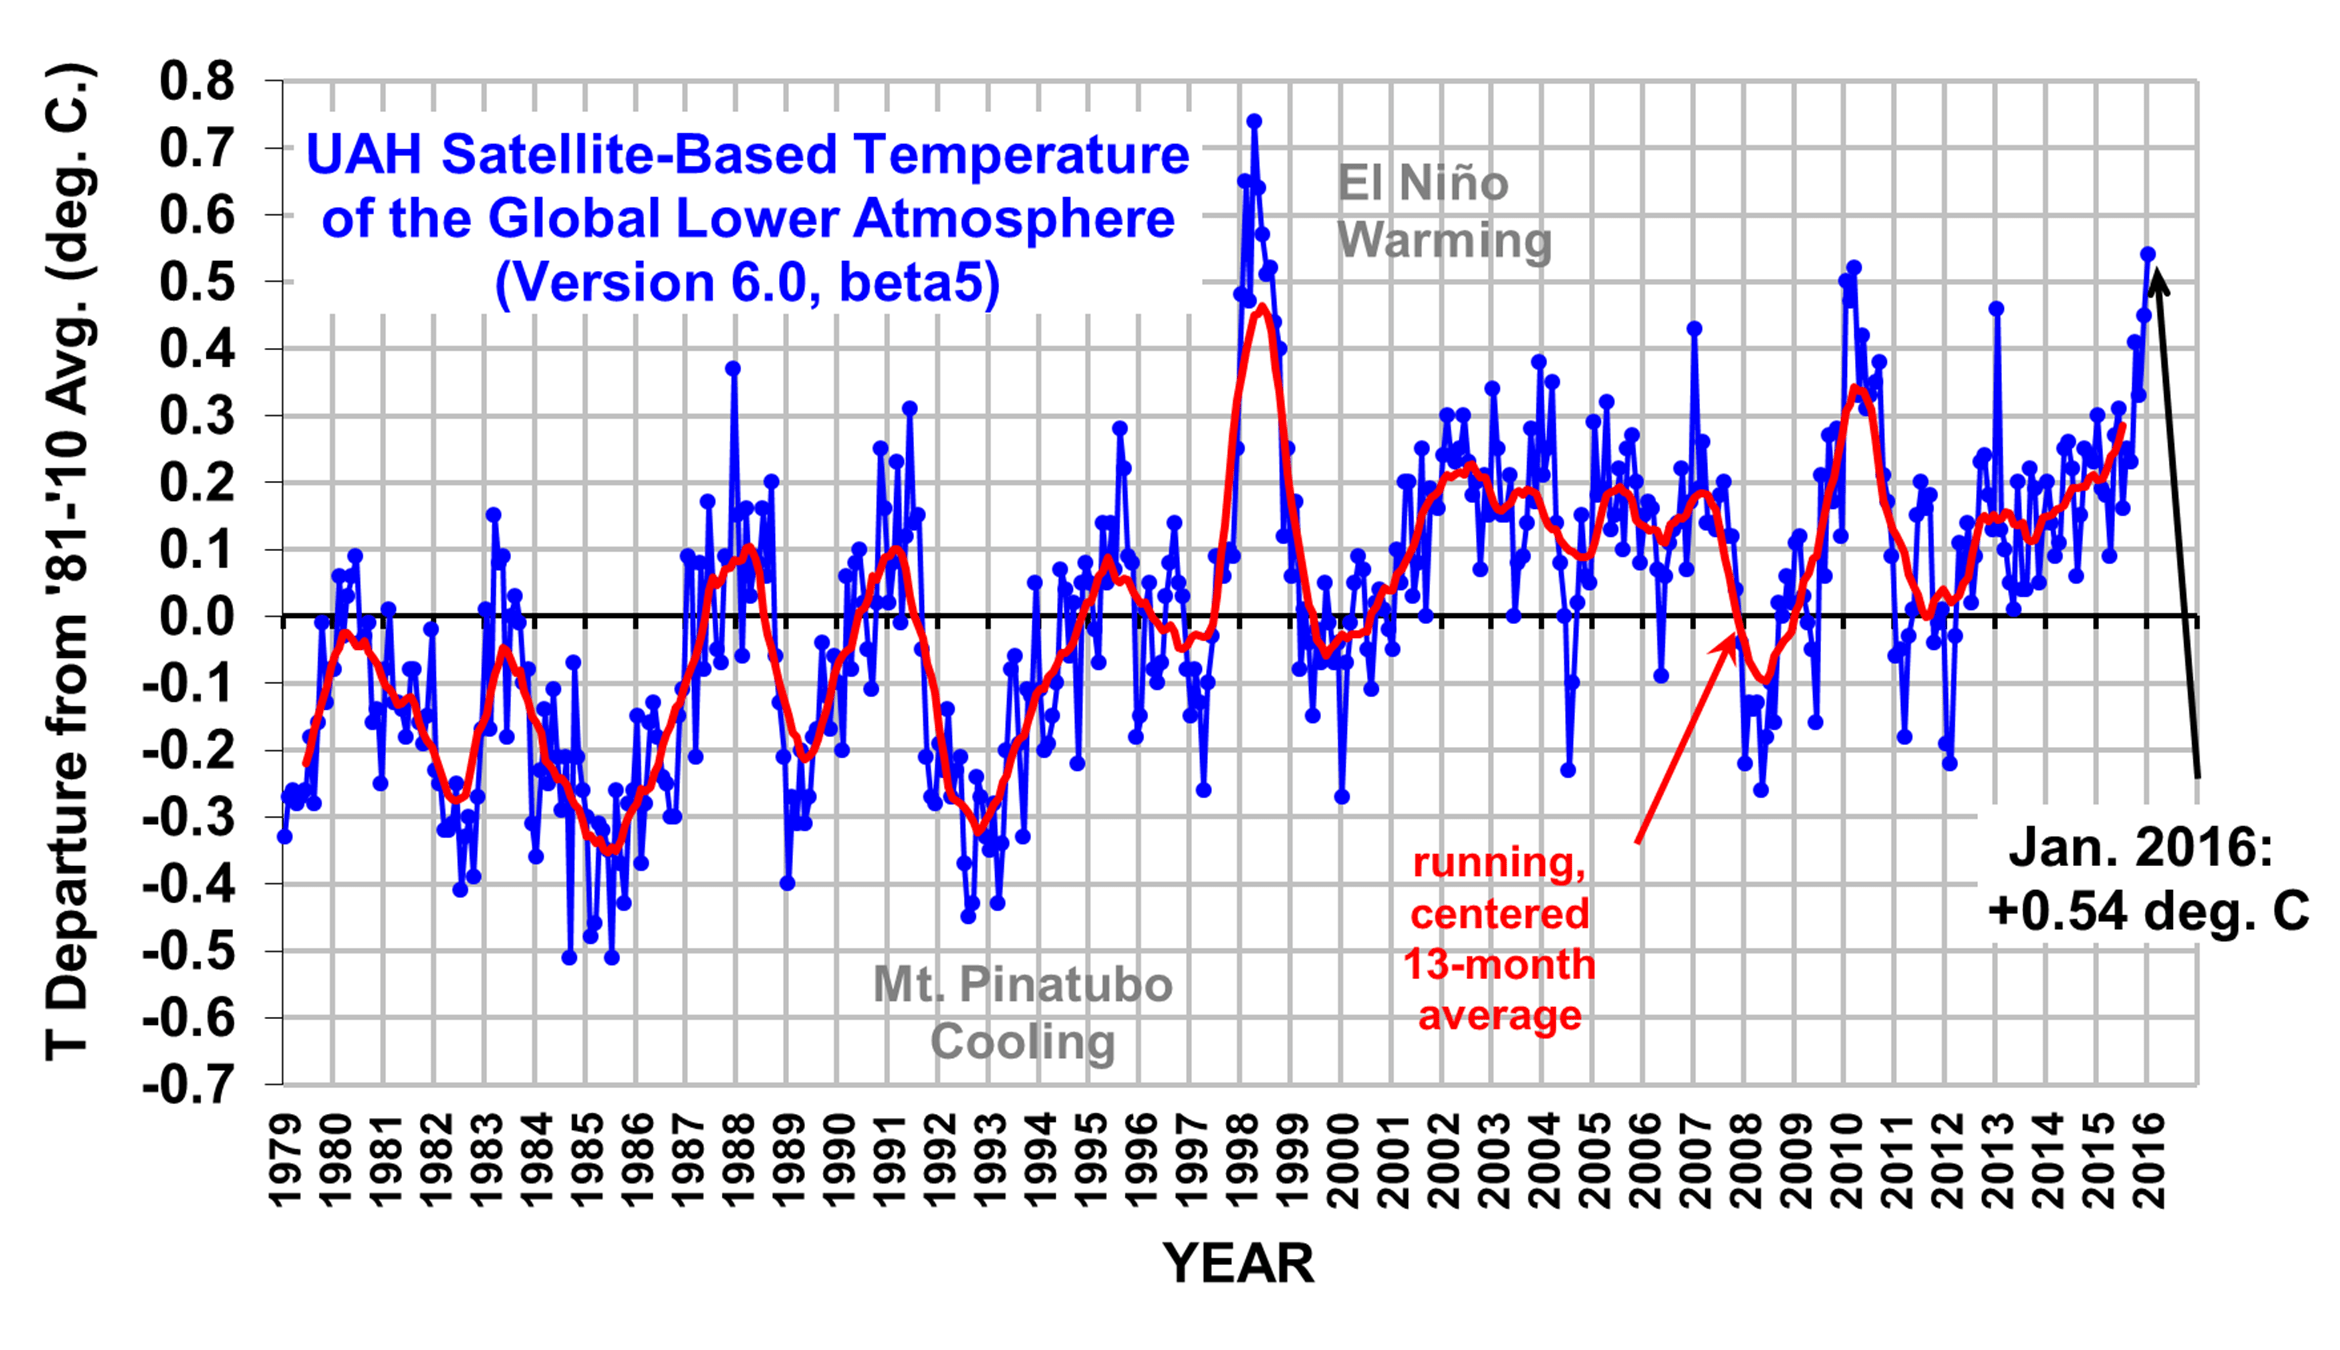
Surface records are better for weather. For climate – assuming that the billions of dollars spent produce reasonable records – we are better off with satellite data. As water vapour rises it condenses and releases the latent heat. Satellites measure all the heat in the troposphere rather than just the sensible heat at the surface. Satellites also give a global coverage impossible with surface thermometers.
 Source: UAH
There is little obvious atmospheric warming since 1998 – consistent with conditions in the Pacific Ocean. From changes over a millennium at least – the cool Pacific state seems likely to persist for a decade or so yet. Beyond that a cooler influence seems likely – as solar intensity declines are amplified through the Pacific climate system.

Pingback: Pauline Hanson’s Mixed Bag | No B-S here (I hope)
Pingback: Robert I. Ellison The Total Failure of Green Stewardship | RUTHFULLY YOURS