Understanding climate require a systems approach that seems little appreciated to date. The consequence of this neglect is that widespread expectations of the future evolution of climate have no validity. The policy implication of a climate system that doesn’t behave to simplistic expectations should be evident. On the other hand the systems approach implies that small changes in the system can drive far ranging changes in the climate state.
The map below show current sea surface temperature anomalies – that is the difference from average temperatures. The oceans have a sun warmed surface layer overlaying the cold depths. Wind and planetary spin keep oceans and atmosphere constantly in motion. In places surface water sinks – driving deep ocean currents –and in others it upwells. Energy moves from the Sun to oceans and land to the atmosphere and out to space. It is technically a coupled, nonlinear system far from thermodynamic equilibrium. A characteristic behavior of the Grand Climate System is relatively stable states punctuated by abrupt shifts that owe more to internal dynamics of the system as a whole than external factors such as greenhouse gases. Traditionally called oscillations. They are spatio-temporal pattern shifts in ocean and atmospheric circulation

Source: NOAA NESDIS
There are many ocean and atmospheric patterns of circulation – some named above – involving changes of sea surface temperature and sea level pressure. One state or another is dominant over a period – from months to millennia – and conditions switch abruptly between states.
The ocean and atmospheric patterns are interconnected in the Grand Climate System. The system slowly evolves in some balance of ice, cloud, vegetation, dust and ocean and atmospheric circulation until pushed past a threshold – a tipping point – at which stage the system balance changes. Marcia Wyatt and colleagues describe the interconnections as a stadium wave. It is a signal that propagates over decades through the components – ice, ocean and atmospheric circulation and biology – of the climate system.
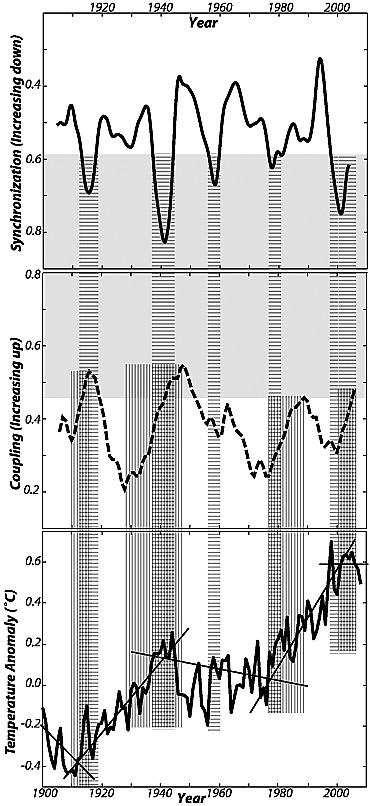
The deterministically chaotic – i.e. the climate butterfly – system has been analysed numerically by Swanson and Tsonis 2009 using network math. These major modes of climate variability – “oscillating” ocean and atmospheric states – can be represented as oscillating nodes on the climate network. Nodes synchronise and coupling increases at times when the Grand Climate System shifts into a new pattern.
At the scale of the 20th century – we can see 4 shifts in the trajectory of surface temperature associated with shifts in climate state at multi-decadal periods. Decreasing temperature to around 1912, increasing to 1946, decreasing to 1976, increasing to 1998 and little change since. These natural climate regimes warm or cool the planet. Variations in both temperature and hydrology have been relatively extreme in the past and there is nothing to suggest that we understand how these will manifest in the future. There are 1000 year peaks in the 20th century in temperature, solar activity and El Niño frequency that imply that longer long cooling is possible.
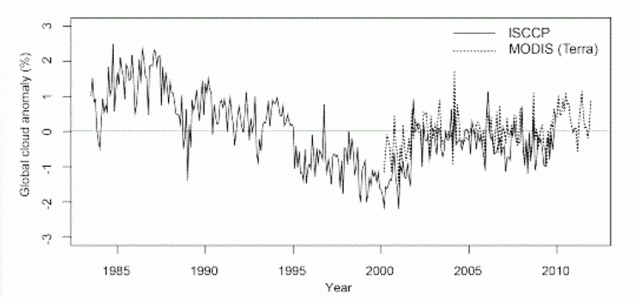
Satellite data suggests that clouds play an important role in natural climate variability. Palle and Laken 2013 combined two different sources of satellite – the International Satellite Cloud Climatology Project (ISCCP) and Moderate Resolution Imaging Spectroradiometer (MODIS¬) – ¬data to provide a record of cloud cover. It a decrease in cloud – more sunlight reaches the surface and warms the planet – to around 2000 followed by an abrupt increase and little change since.
Wong et al 2006 use a different satellite record – the Earth Radiant Energu Budget (ERBS) – which shows a decrease in visual light (SW) reflected from clouds. The different satellite records are consistent – providing an important confirmation. Consistent records from different sources providing a plausible explanation for warming in the last decades of the 20th century.
If natural variations are the dominant cause of recent warming – as the satellite data suggests – then the planet may not warm for decades and the future beyond that is unknowable. While there may indeed be additional energy in the system as a result of greenhouse gases – it is set against a background of large natural variability driven by internal climate processes.
“If as suggested here, a dynamically driven climate shift has occurred, the duration of similar shifts during the 20th century suggests the new global mean temperature trend may persist for several decades. Of course, it is purely speculative to presume that the global mean temperature will remain near current levels for such an extended period of time. Moreover, we caution that the shifts described here are presumably superimposed upon a long term warming trend due to anthropogenic forcing. However, the nature of these past shifts in climate state suggests the possibility of near constant temperature lasting a decade or more into the future must at least be entertained.” Swanson and Tsonis op. cit.
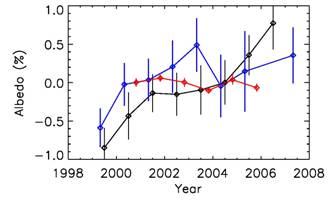
There is yet another source of data for the shift in cloud at the turn of the century – light reflected off the Earth onto the moon. Project Earthshine data show changes in albedo shown in blue, ISCCP-FD shown in black and CERES in red. The step increase in reflected light at the turn of the century – and little change since – is consistent with the satellite data and the network analysis of Swanson and Tsonis.
The changes in temperatures trends follow changes in the El Niño – Southern Oscillation with compelling temporal correlations. More frequent and intense La Niña (blue) to 1976, El Niño (red) to 1998 and La Niña again since.
The Pacific Decadal Oscillation has the same temporal pattern of warm and cool surface water – which raises interesting questions about how these northern and southern hemisphere ocean phenomenon are linked.
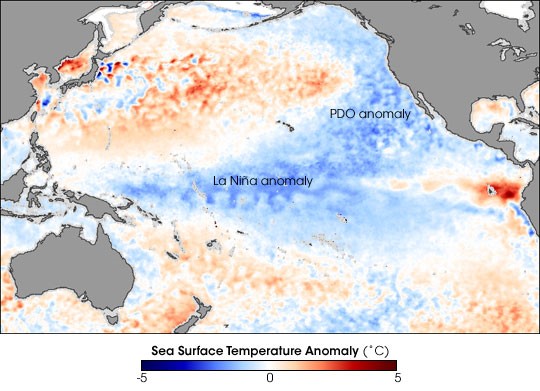
Both phenomenon are the result of more or less cold and nutrient rich upwelling in the eastern Pacific. The graphic from NASA below shows a cold PDO and La Niña in the Pacific. “Unlike El Niño and La Niña, which may occur every 3 to 7 years and last from 6 to 18 months, the PDO can remain in the same phase for 20 to 30 years. The shift in the PDO can have significant implications for global climate, affecting Pacific and Atlantic hurricane activity, droughts and flooding around the Pacific basin, the productivity of marine ecosystems, and global land temperature patterns.”
In La Niña the Pacific trade winds intensify pushing warm surface water towards the western rim. Warm water flows between Australia and Indonesia influencing sea surface temperature in the Indian Ocean and rainfall in Africa and Australia.
That the Pacific phenomenon involve upwelling suggests that more or less flow in cold currents – the Peruvian and Californian Currents – displace more or less of the overlaying warm ocean layer. The cause of cold current variability – biasing the system to more or less cold water upwelling in the eastern Pacific – is likely wind shifts in high latitudes.
“Winds and temperatures in Earth’s atmosphere vary from month to month and year to year in countless ways. Decades of monitoring the weather and climate have revealed a few simple patterns that explain much of this variability.
The severity of wintertime climate over North America and Europe, for example, has been strongly linked to the most prominent atmospheric pattern in the Northern Hemisphere, which is called the “northern annular mode.” It is a natural shift of air masses back and forth between the North Pole and mid-latitudes. At some times, we see a surplus of air mass and pressure over the pole and a deficit at around 45°N; at other times, the air mass is redistributed to create a deficit at the pole and a surplus in mid-latitudes.
This seesaw exchange of air masses shifts temperature conditions and storm patterns throughout the region. The pattern of this exchange may change from one week to another, or it may recur for several winters in a row. There even seem to be long-term trends in the pattern that continue for decades.
So, in many cases, we know the what, where, and when of these atmospheric patterns. But how and why these patterns happen is less clear. Many scientists have investigated the driving forces behind changes in the northern annular mode and a similar pattern of changes, called the “southern annular mode,” that occurs over Antarctica and the Southern Hemisphere. If we can comprehend the physics behind these changes, we might someday reach a point where we can predict not just the weather, but some aspects of longer-term climate.” Why the West Wind Wobbles.
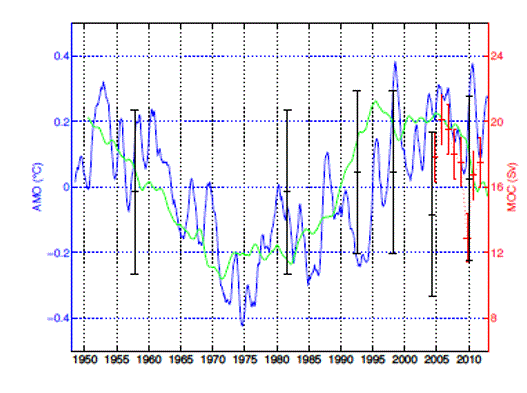
Smeed et al 2014 use data from the new Atlantic Ocean current program – the 260 N array – to suggest a link between the North Atlantic Oscillation (NAO) – the Atlantic arm of the Northern Annular Mode – and the Atlantic Meridional Overturning Circulation (AMOC). The cumulative NAO index is shown in green, the AMO in blue and AMOC in red. AMOC ¬is implicated in the most fundamental and wide ranging changes of global climate – the plunge into and climb out of glacials over the past 2.58 million years. At this stage in Earth’s orbit summer sunlight in high northern latitudes is at a minimum, the Arctic is open, the surface is warming and fresh water is pouring into the north Atlantic. This leads to a decline in the Gulf Stream and a northern hemisphere cooling. Times like this in the past have triggered runaway ice feedbacks that culminate in kilometre deep ice sheets over much of Europe and North America. Should this happen – it is difficult to see why these major climate movements wouldn’t overwhelm minor changes in temperature from greenhouse gases.
The physics of atmospheric mass movements at high latitudes certainly include stratospheric ozone and solar UV. Ozone absorbs energy in UV frequencies and warms changing the density of the air column and sea level pressure beneath the column. It suggests another pathway for solar influence on climate. The mass atmosphere movements in turn influence major modes of climate variability.





Can I send this on to WUWT or Bob TIsdale.? great paper!
You may – but I have found Watts to be an idiot.