
Climate monitoring this century achieved new levels of precision – and it puts into doubt key assumptions of the theory of global warming. Most of the discourse on global warming is about who said what about the temperature at 2 metres from the ground – the surface temperature record – and whether the planet is warming or not. It is the wrong place to look for an answer to that question. For a much more complete Earth energy budget – data on ocean heat, solar radiance and energy radiated at the top of the atmosphere is required. The most precise and comprehensive Earth energy monitoring system ever assembled shows that most warming – and cooling – this century was entirely natural.
Although it is a very minor part of the global energy system – a quick aside on surface temperature is useful given the undue attention it receives. Land temperatures are measured as sensible heat (the heat you can sense) by thermometers in a box at 2m from the ground. Ocean temperatures are measured as sea surface temperature – most often using floating buoys. In explanation, most usually what we see as data is the change from conditions in a baseline period defined as the ‘climate normal’ – so-called anomalies. Latent heat is the energy that melts ice or vaporises water. This is a large part of the surface energy flux and it is not measured by thermometers. As water vapour condenses higher in the atmosphere, heat is released and is measured by satellites. The most significant problem in the surface temperature is the divergence of the land and ocean records this century. Land is warming faster than ocean surface temperatures. This can only happen if the land is drying out leading to more sensible and less latent heat flux at the surface. From 1st principles – the land surface record is not a consistent or complete record of energy in the atmosphere and we must look elsewhere to draw reasonable inferences.
The Argo project has 3900 floats in the oceans that sink measuring temperature and salinity at different depths and then, at the surface again, relay data back to base via satellites. The system is an immense improvement over haphazard methods of the past. Cloud and Earth’s Radiant Energy System (CERES) instruments aboard NASA satellites measure incoming and outgoing radiant power at the top of the atmosphere. Radiant power over time is energy – one Watt for one second is one Joule. CERES also measures water vapour in the atmosphere, clouds and the temperature in the bottom 50 kilometres of the atmosphere. Greenhouse gas forcing should cause air in the troposphere to warm and the stratosphere to cool. As indeed it does – but climate is not that simple.
The global energy equation is very simple.
Δ(H&W) ≈ Ein – Eout
The change in heat energy content of the planet – and the work done in melting ice or vaporising water – is approximately equal to energy in less energy out. There are minor contributions with heat from inside the planet and the heat of combustion of fossil fuels that make it approximate but still precise enough to use. Energy imbalances – the difference between energy in and energy out – result in ocean warming or cooling. The oceans are by far the greatest part of Earth’s energy storage – and Argo record gives us a real sense of whether the planet is warming or cooling – or both at different times.

Source: Professor Ole Humlum
The solid blue line is the average temperature of the world’s oceans between the surface and 1900m depth – the dashed line is a 13-month running mean. Cooling in the early record is not explicable in any manifestation of global warming theory. The best that is done is to wave hands, call it natural variability and pretend it doesn’t matter. But unless there is a better understanding of natural variation it is impossible to determine the impact of global warming.
‘Our interest is to understand – first the natural variability of climate – and then take it from there. So we were very excited when we realised a lot of changes in the past century from warmer to cooler and then back to warmer were all natural,’ Anastasios Tsonis, Atmospheric Sciences Group, University of Wisconsin
The large annual variability is due to north-south asymmetry. There is more ocean in the Southern Hemisphere and the oceans warm in the Austral summer. The changes in the running mean are due to other factors. The underlying principle is that a change in energy in or energy out causes the planet to warm or cool. When 390the planet warms disproportionately more energy is emitted (temperature to the 4th power) – and disproportionately less energy when there is cooling. The planet moves towards energy equilibrium.
There was a nominal increase in greenhouse gas forcing of 0.864W/m2 since 1990 – although the real world isn’t cooperating (Keenan et al 2016). The global warming theory is that a very, very small increase in greenhouse gas forcing – an instantaneous rate of increase of 0.00000001W/m2 (Watts per metre squared) – caused an energy imbalance of some 0.5W/m2 to accumulate at the top of the atmosphere (TOA) – more energy in than out – over time due to the thermal inertia of the planet. If you put a candle under a pot – water in it will warm over time until the energy losses equal the energy input from the candle. The time delay is a result of thermal inertia. If you overheat the pot with a blowtorch – which you then take away – the pot will cool to the equilibrium temperature. Thermal inertia is far less relevant when there are other, much larger, sources of heat than the candle.
Of course, the planet is many orders of magnitude more complex. There are multiple sources of energy – certainly in the short term much greater than the change in greenhouse gas forcing. Extra heat from all sources – including the interior of the planet, fossil fuel burning, nuclear fission, solar radiance, north-south asymetry and – the big one – cloud radiative forcing – is retained in planetary systems as longwave emissions and shortwave reflectance adjusts to balance the global energy budget. Reality contrasts starkly with the idea that the planet is slowly warmed from greenhouse gases alone.
Energy imbalances – from all causes – cannot be determined directly from satellite records. The error bounds on absolute values are far too great. Variations are much more precise and show changes in energy in and energy out. This gave us clues about the underlying causes of climate change.
The Sun is the source of energy in. It changed over the Schwabe cycle since the turn of the century. Remembering that energy at the surface is one-quarter that at TOA – because the planet is more round than flat – the change in solar radiance has the same form as Argo warming and cooling – but cannot explain the extent of the changes.

Source: CERES Data Products
It is well established that solar UV and ozone interact at the poles – changing sea level pressures. These changes in low solar activity push polar storms into lower latitudes and spin up ocean gyres. In the Pacific Ocean more flow in the Peruvian and Californian currents trigger more frigid and nutrient rich upwelling in the north-eastern and central Pacific. It causes immense variability in Pacific Ocean sea surface temperatures which set up feedbacks in wind and currents. With more upwelling’ the atmosphere cools and more warmth is retained in the global system – but there is more cloud to reflect solar shortwave. The net effect is a cooler planet over decades to millennia. There are as well dramatic impacts on global hydrology and biology. Small solar changes are thereby amplified through the terrestrial climate system.
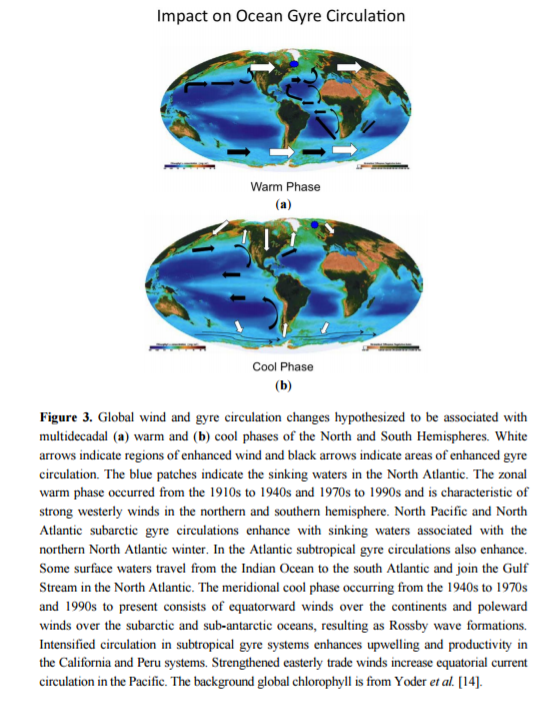
Source: http://www.mdpi.com/2225-1154/3/4/833/htm
The schematic shows enhanced polar winds driving sub-polar winds and currents in cool climate regimes.
The 20 to 30 year regimes referred to in the Tsonis quote above are part of the system. They were discovered by hydrologists, oceanographers and biologists – nothing to do with physics at all. They can’t be modelled. The last Pacific climate shift happened in 1998/2001. The next is due in a window of 1918 to 2018 – and we will have a complete record this time. A cooling sun suggests that the next shift will be to yet cooler conditions.
I have included two versions of energy out – the raw variability and the deviation from monthly averages with a 13-month running mean. Net power flux positive is warming by convention. There are very large annual variations. This is again north-south asymmetry. The planet reflects more shortwave in the southern summer and emits more longwave in the northern summer – producing a complex pattern of net radiation.
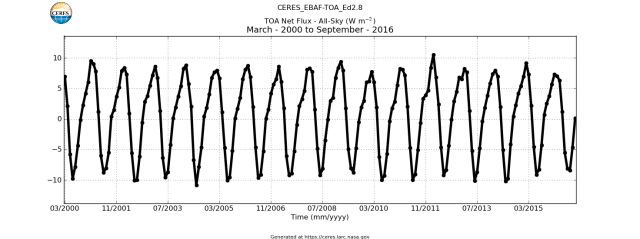
Source: CERES Data Products
This one is the money shot – and we can actually see a 13-month running mean against a smaller variability. The combinations of factors – ice, cloud, water vapour, atmospheric temperature – caused cooling in the first years of the century and a little warming since. The changes are almost entirely the result of cloud cover and atmospheric temperature changes related to Pacific upwelling variation. Earlier satellite data – Earth Radiation Budget Experiment (ERBE) and the International Satellite Cloud Climatology Project (ISCCP) – were cobbled together from instruments not designed for the purpose. They have been ‘adjusted’ as much as the surface temperature record. They do in their final form, however, agree in showing that reduced cloud cover was the major cause of warming late last century. There are confirming sea level observations of cloud in the Pacific.
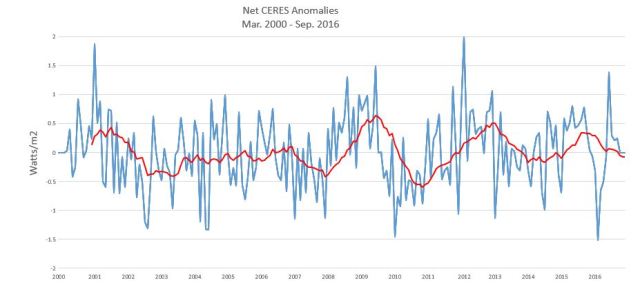
Data Source: CERES Data Products
The are fundamental things in climate that lead to immense variability over millennia – the 20th century was relatively balmy compared to other periods in the recent past. Short-term variability is sufficient to account for changes in ocean heat without resort to an accumulating energy imbalance from greenhouse gases. The Pacific Ocean solar amplifier opens up the potential that most 20th century warming was natural and the prospect for that energy to be lost this century. Pacific Ocean climate shifts mean that the next decade should be very interesting.

Thanks for this thorough exploration of natural climate variability. This is a keeper!
Thanks